Stocks
Analyze liquid NASDAQ and NYSE stocks with structured levels, market bias and risk-defined setups.
Explore StocksGet actionable market analysis for Stocks, Forex and Crypto — with entry zones, stop loss, TP1, TP2 and TP3.
Free account · No credit card required


Track major US stocks, Forex pairs and Gold before moving into deeper TradingInte analysis.
External TradingView charts; availability and delays depend on the symbol and provider. Chart data is separate from the platform’s demo data. If the chart cannot load, open it on TradingView.
Demo interface figures — not live prices
| Symbol / company | Market | Last price | Change % | Data status |
|---|---|---|---|---|
| AAAAPLApple Inc. | US Stocks | 228.12 USD | -1.38% | DEMO DATA |
| NVNVDANVIDIA Corporation | US Stocks | 109.11 USD | +0.61% | DEMO DATA |
| MSMSFTMicrosoft Corporation | US Stocks | 44.11 USD | +3.61% | DEMO DATA |
| AMAMZNAmazon.com Inc. | US Stocks | 217.66 USD | +0.16% | DEMO DATA |
| GOGOOGLAlphabet Inc. | US Stocks | 34.35 USD | +3.85% | DEMO DATA |
| MEMETAMeta Platforms Inc. | US Stocks | 156.81 USD | -2.69% | DEMO DATA |
| TSTSLATesla Inc. | US Stocks | 122.15 USD | -1.35% | DEMO DATA |
Scan opportunities across the markets you trade without switching between disconnected tools.
Analyze liquid NASDAQ and NYSE stocks with structured levels, market bias and risk-defined setups.
Explore StocksTrack major currency pairs and Gold with technical context, entry zones and clearly defined invalidation.
Explore ForexFollow high-liquidity crypto assets including Bitcoin, Ethereum and leading altcoins across key timeframes.
Explore CryptoNot just a direction. See the levels that define the opportunity, the risk and the potential path.
A defined price area where the setup becomes actionable.
A clear invalidation level designed to define risk before the trade.
The first objective for managing the position as price develops.
A secondary objective when momentum continues in the expected direction.
The extended target for setups that develop into stronger moves.
TradingInte combines market structure, momentum, technical levels and risk context to turn raw market data into a setup you can understand.
Trend direction, breakouts, pullbacks and invalidation.
Support, resistance, momentum and relevant indicators.
Entry and target levels are evaluated against the defined risk.
A concise score summarizes the strength of the current setup.
Price is holding above an established support zone while momentum remains constructive. The setup defines where the thesis becomes invalid and separates profit objectives into three levels.
Upload a screenshot from TradingView, MT4, MT5 or your broker platform. TradingInte analyzes the visible chart structure and turns it into practical trading context.
AI chart analysis supports your research. It does not execute trades or guarantee market outcomes.

Paid plans are available by bank transfer.
Total payment
Total payment · 1 months
$45.00 / monthTotal payment · 3 months
$39.67 / monthOfficial international economic announcements. Headlines remain in English. Original content is available free from the Federal Reserve and European Central Bank; platform subscriptions do not purchase access to these sources.
 AI Trading
Evaluate AI trading tools by data quality, traceable evidence and realistic limits. Learn what to verify before relying on charts,...
Read article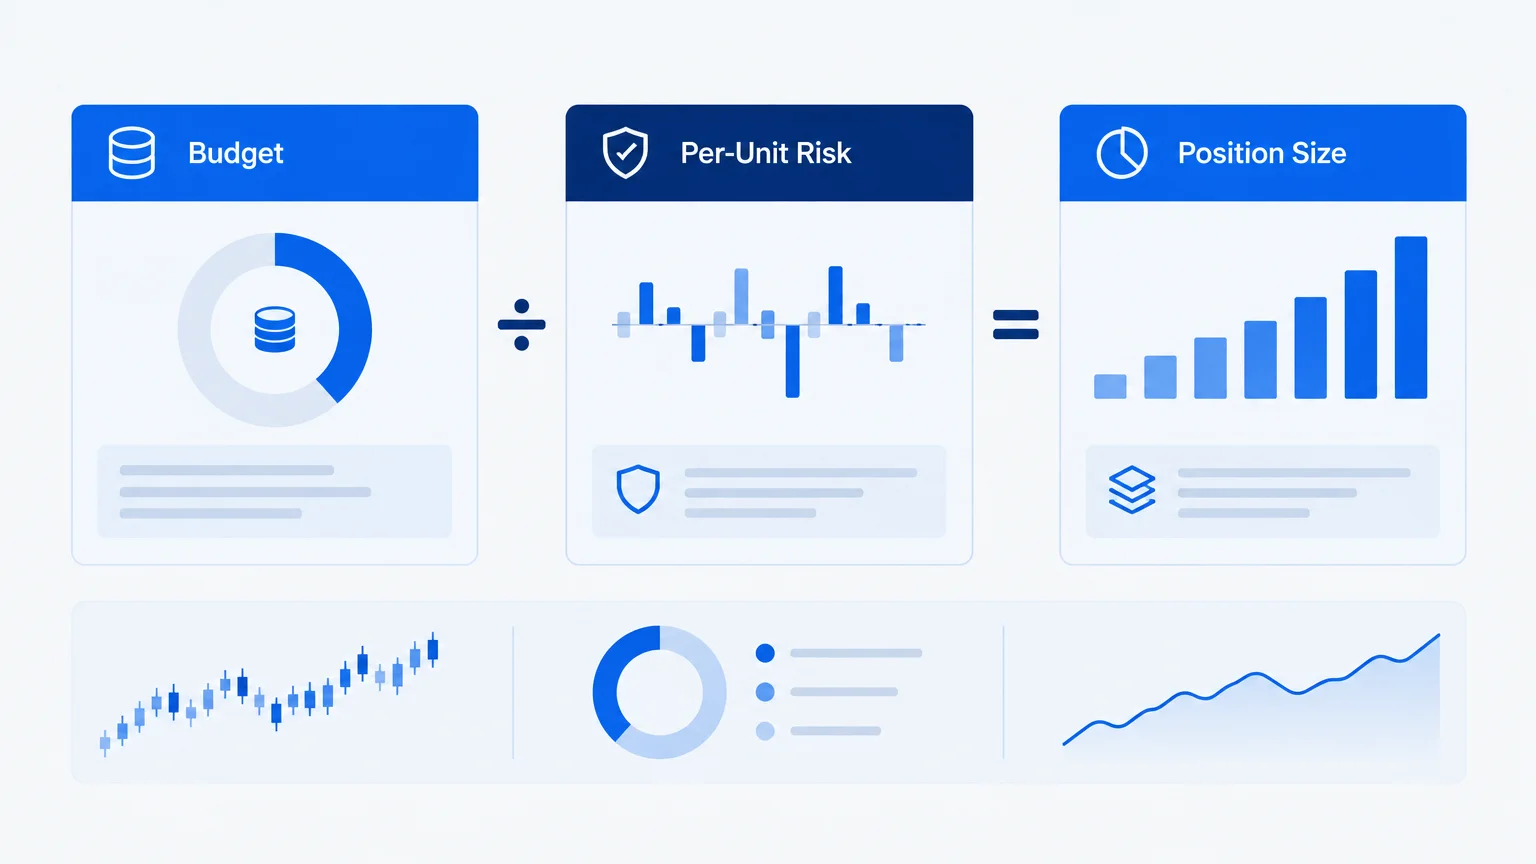 Risk Management
Calculate position size from a cash-risk budget and exit distance, verify contract units and currency conversion, and account for...
Read article Risk Management
Define a trading setup's failure condition, distinguish invalidation from stop execution and use price, time and event rules witho...
Read articleNo. TradingInte provides trading intelligence, market analysis and decision-support tools. You remain in control of every trading decision and execution.
TradingInte is built around three core markets: US Stocks, Forex and Crypto. Market coverage depends on the data providers enabled for each asset.
A complete setup can include market direction, entry zone, stop loss, TP1, TP2, TP3, risk/reward, confidence, timeframe, market bias and the analysis behind the setup.
Yes. Upload a chart or trading-platform screenshot to analyze the visible trend, support and resistance areas, market context and potential trading levels.
Trading levels are generated from market data and quantitative analysis. AI is used to help explain the setup and its context rather than inventing prices without supporting market data.
Choose 3 months for $199 or 6 months for $350. Paid access is activated after your bank transfer has been reviewed and approved.
No. Markets involve risk and no analysis can guarantee a profit or outcome. Data, technical analysis and AI-generated explanations can also be incomplete, delayed or inaccurate.
Stocks. Forex. Crypto. One platform for structured market analysis, clear levels and better-informed trading decisions.
Create Free Account No credit card required.