How to Analyze a Stock Chart Step by Step
Learn to review stock chart settings, trends, support, resistance, volume and company events before defining an entry, invalidation and exposure plan.
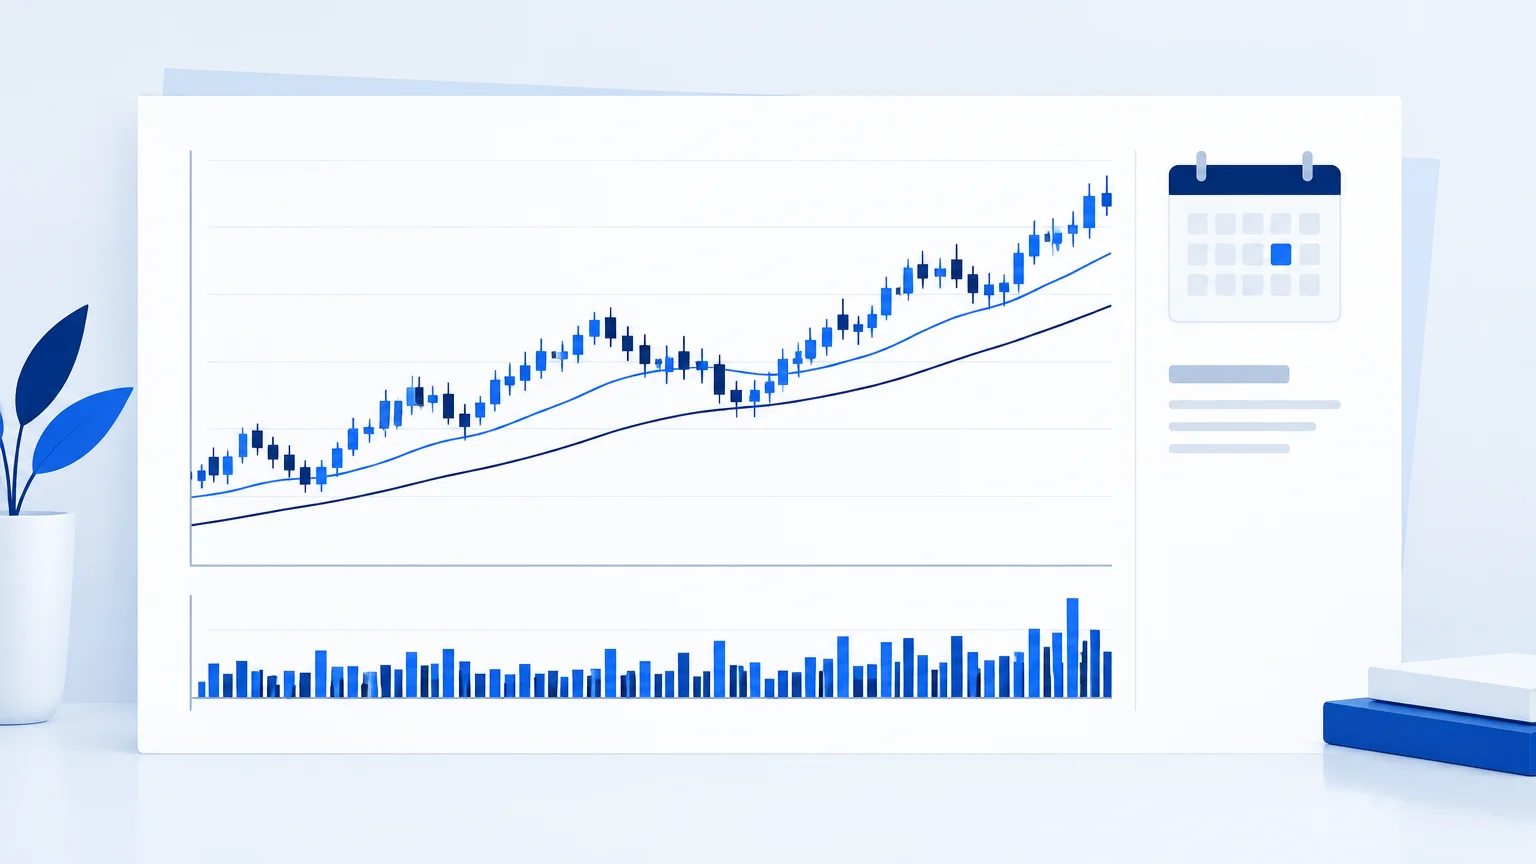
Learning how to analyze a stock chart starts with a simple separation: the chart describes the market's price behavior, while the business explains what the security represents. Neither replaces the other. This step-by-step method focuses on the chart while keeping company events and execution constraints in view.
Use the same sequence each time. The aim is not to discover a perfect indicator combination. It is to produce an explanation that another person could inspect and understand, including the evidence that would make you change your mind.
Step 1: verify the security and settings
Confirm the ticker, exchange and share class. Check whether the chart is adjusted for splits and other corporate actions. A large historical jump may reflect an adjustment issue rather than a tradable market event. Compare suspicious gaps with the company's announcements or your data provider's notes.
Choose whether you are examining regular trading hours or an extended session. Activity and spreads can differ, and the two views may show different highs and lows. Record the setting so a later screenshot or AI analysis does not silently compare unlike charts.
Select a normal price chart if your task requires executable levels. Smoothed candle representations can be helpful for visualizing a trend, but their displayed values may not correspond directly to actual transactions.
Step 2: begin with the broader structure
Look at enough history to identify the major swings around the current price. Describe whether highs and lows are generally rising, falling or overlapping. Avoid letting one large candle determine your entire interpretation.
Next locate the current price within that structure. A stock near the upper edge of a long range presents a different question from one recovering near the lower edge. An upward trend can still be extended relative to its nearest defensible risk level.
The guide to market structure provides definitions for swings, breaks and transitions. Use those definitions consistently rather than changing them to accommodate each new chart.
Step 3: map support and resistance
Mark a small number of significant areas: a prior swing high, a defended low, a consolidation boundary or an unfilled portion of a notable gap if relevant to your method. Label the reason for each area in your notes.
Treat closely grouped reactions as a zone. A line drawn through one wick can create an illusion of precision. The useful question is how price behaves around the area, not whether it touches your exact line to the smallest quoted increment.
For a fuller explanation, read support and resistance. Remember that a level can lose relevance after a major company event or a change in the surrounding structure.
Step 4: examine participation and movement
Compare recent volume with the stock's own relevant history. A large absolute volume number means little without context. Also consider session effects and unusual events; a single busy bar may reflect an announcement, rebalancing or another temporary condition.
Observe how price moved, not only how far. Did it progress steadily with shallow pullbacks, or jump and immediately reverse? Were recent candles overlapping? Did an attempted break close back inside the previous range?
Volume can support an interpretation, but it does not identify the motives of every participant. Avoid statements that confidently assign all buying to institutions or all selling to uninformed traders based only on a public chart.
Step 5: use indicators for a defined question
A moving average can help describe trend direction or distance from a reference. An oscillator can help describe momentum. A volatility measure can help compare current movement with previous conditions. Choose an indicator because it answers a question, not because an empty panel feels incomplete.
Several indicators derived from the same closing prices are not necessarily independent confirmations. If they disagree, return to the question each is designed to answer. A strong trend and a stretched oscillator reading can coexist without either being “wrong.”
Keep the settings recorded. Comparing a short moving average today with a longer one in a previous review creates a change in the method, not necessarily a change in the market.
Step 6: check the company calendar
Identify upcoming earnings, material corporate announcements and known events that could affect the intended holding period. Verify dates from an appropriate source rather than assuming a chart marker is complete or current.
An earnings gap can move beyond a planned exit before an order can execute near it. This does not make chart analysis useless; it means the event is part of the risk assessment. If the setup depends on ordinary volatility, a major scheduled event may invalidate that assumption even before price moves.
The AI stock research guide explains how to connect technical context with company information without confusing an AI summary with a verified filing.
Step 7: write a conditional trade thesis
In a fictional example, a stock is approaching the top of a sideways range after forming a higher low. An upward scenario could require a completed close above the range and subsequent acceptance. A failed attempt followed by a return to the range would weaken that case.
Do not automatically set the target at a distant round number. Identify the next visible obstacle, then assess whether the distance justifies the proposed risk. If the entry occurs later and higher than expected, recalculate. The chart's earlier opportunity does not remain available merely because the original analysis was correct.
Read the entry-zone guide for the trade-off between entering near a level and waiting for additional evidence. The right choice depends on a tested method and execution constraints, not a universal rule.
Step 8: size and document the idea
Translate the distance to invalidation into a monetary risk estimate using the actual instrument. Then account for costs and the possibility of worse execution. Position size should follow the risk plan rather than determine where a convenient stop is placed.
Save the chart, timestamp and conditions before acting. If you decide not to trade, record why. Rejected setups are useful learning material because they show whether your filters are consistent or merely explanations created afterward.
Review the outcome without moving the original lines. Ask what information you had, which assumptions were reasonable and which were unsupported. This creates a more honest learning record than judging every losing trade as a bad analysis.
Check the scale before comparing movement
A chart’s visual slope depends on its scale and the amount of history displayed. A movement that looks steep in one window can appear modest in another. When comparing periods, use actual changes and consistent settings rather than the angle of the drawn line. If using a logarithmic scale for a longer history, understand that it emphasizes proportional movement. The choice should support the question and be recorded, particularly when comparing screenshots from different sources.
Key takeaways
- Verify the security, adjustments and session before interpreting the chart.
- Read structure and location before adding indicators.
- Keep company events inside the risk assessment.
- Recalculate when the actual entry differs from the planned one.
- Preserve the original chart for a fair review.
Frequently asked questions
Which chart timeframe should a beginner use?
Choose a timeframe that matches the decision and allows you to review it consistently. A broader chart can reduce visual noise, but it does not reduce the importance of risk controls or make every trend easier to trade.
Does high volume make a breakout reliable?
It can add context, but no single observation establishes reliability. Examine the close, follow-through, surrounding levels and reason for unusual activity. A busy failed breakout is still a failed breakout.
Should I buy every pullback in an uptrend?
No. The pullback's location, structure, event context and available reward matter. An upward trend is a description, not permission to ignore entry quality or risk.
Why do two stock charts show different historical prices?
Possible causes include adjustment settings, sessions, data vendors and different securities. Resolve the difference before comparing levels. Do not assume one is wrong simply because it looks unfamiliar.
Can TradingInte help with this process?
It can organize chart and market context into a structured analysis. Check its observations against your source chart and confirm company facts separately. It does not remove the need for your own decision and risk assessment.
Conclusion
A stock-chart review should end with a clear scenario, not a collection of indicator readings. Confirm the data, read the structure, locate the important areas and connect the idea to practical risk. If those pieces do not fit together, leave the setup on the watchlist.
Prepared with AI assistance
Keep exploring
 Stocks
AI Stock Analysis: How AI Can Support Stock Research
Use AI stock analysis to organize filings, business questions, valuation assumptions and chart context while verifying sources and...
Read article Stocks
How to Analyze NASDAQ Stocks Before a Trading Decision
Research Nasdaq-listed stocks through company facts, relevant peers, sector context and chart structure while checking events and...
Read article