Market Structure in Trading: Trends, Breakouts and Reversals
Read market structure through swings, trends, ranges and transitions. Define confirmation, invalidation and timeframe without relying on hindsight.
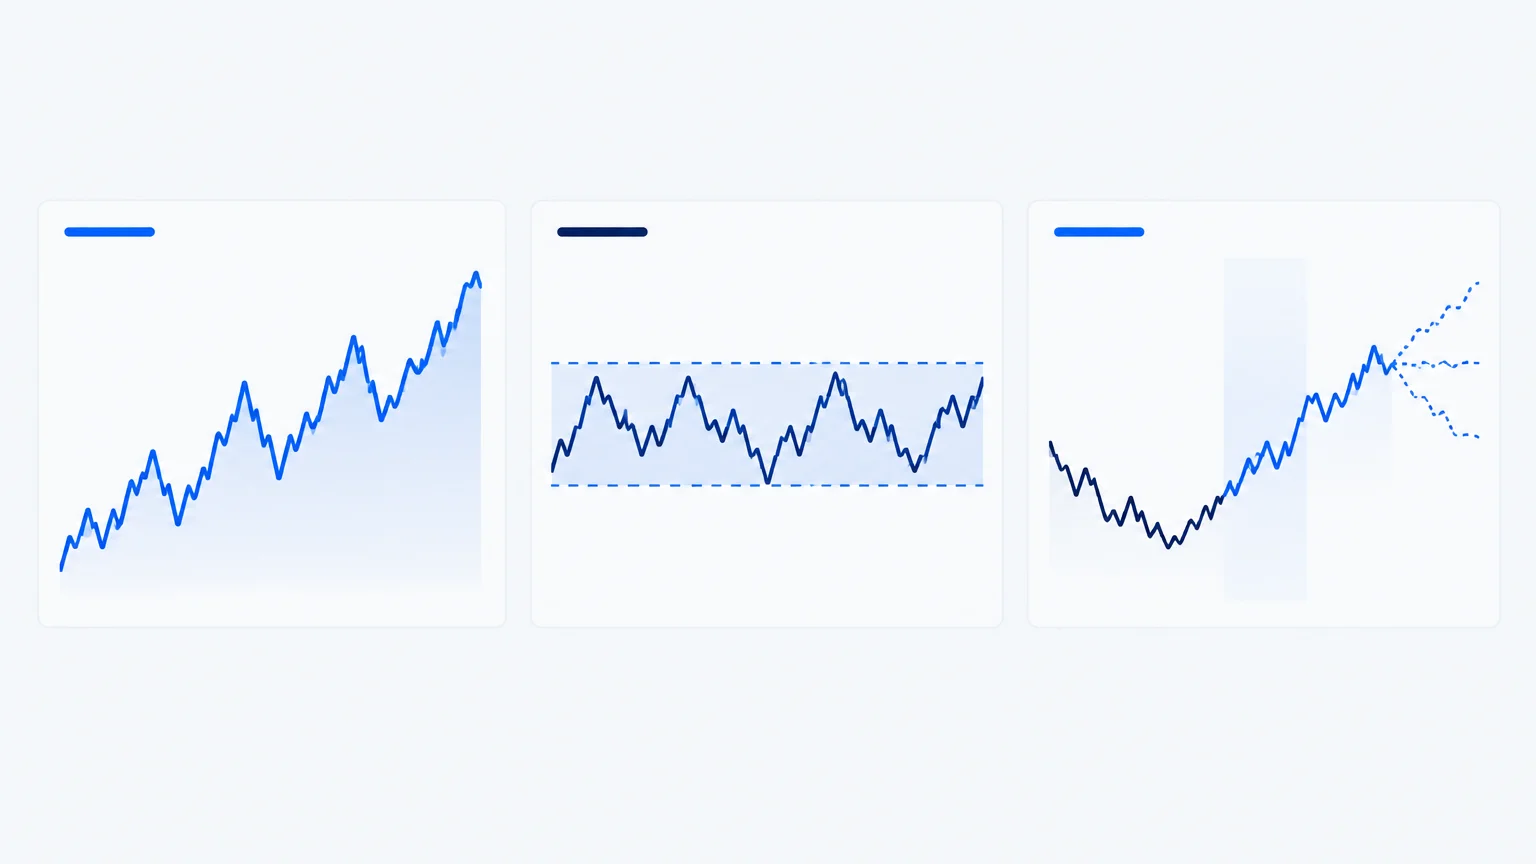
Market structure is a way of describing how price progresses through swings and ranges. It helps answer whether a market is advancing, declining, consolidating or transitioning between those conditions. The description is always tied to a timeframe: an upward move on a short chart can sit inside a larger decline.
The value of structure is not a special vocabulary. It is a consistent set of observations that connects your interpretation to a condition that could prove it wrong. This guide focuses on that practical use.
Define a swing consistently
A swing high is a local peak relative to surrounding price behavior, and a swing low is a local trough. Different methods require different amounts of surrounding evidence before confirming a swing. A very sensitive method finds many small turns; a broader method ignores minor fluctuations.
Choose the sensitivity before reviewing outcomes. If a swing is only considered confirmed after later bars, acknowledge that delay. A historical chart makes every turning point look obvious, but the same information was not necessarily available in real time.
This matters when reviewing screenshots or AI-generated annotations. Ask whether the highlighted swing was identifiable at the time of the proposed decision, not only after subsequent candles formed.
Recognize trends without expecting straight lines
An upward structure often contains progressively higher important highs and lows. A downward structure often contains lower highs and lows. The word important matters: a small fluctuation inside a pullback should not automatically overturn the larger description.
Trends contain pauses and counter-moves. A pullback is not automatically a reversal, and a new high is not proof that continuation will persist. Describe the current evidence and specify which reference would change the assessment.
For the directional terminology, read bullish versus bearish. A bias should summarize the evidence on a timeframe, not become a permanent identity attached to an instrument.
Identify ranges and their interior
A range is an area of overlapping trade in which directional progress is limited under the chosen definition. Its upper and lower boundaries may attract attention, while the middle often offers less clearly defined asymmetry.
Ranges are not always neat rectangles. Boundaries can be tested unevenly, and brief excursions can occur before price returns. Mark zones based on visible reactions rather than forcing every candle into a perfectly symmetrical box.
The support-and-resistance guide explains how to map those areas. In a range, location can matter as much as the shape of the latest candle.
Distinguish a break from a transition
A move beyond a prior swing changes the evidence, but the significance depends on the swing, timeframe and subsequent behavior. A minor intraday high breaking inside a larger declining structure may indicate a local recovery rather than a full reversal.
Define whether your method requires a close, follow-through, retest or another condition. Each choice has a trade-off: waiting may reduce some ambiguity but can produce a later entry. No confirmation method eliminates failed breaks.
Avoid treating a named pattern as proof. Terms such as break of structure are only useful when the referenced swing and rule are clear. Two analysts can use the same term for materially different events.
An illustrative transition sequence
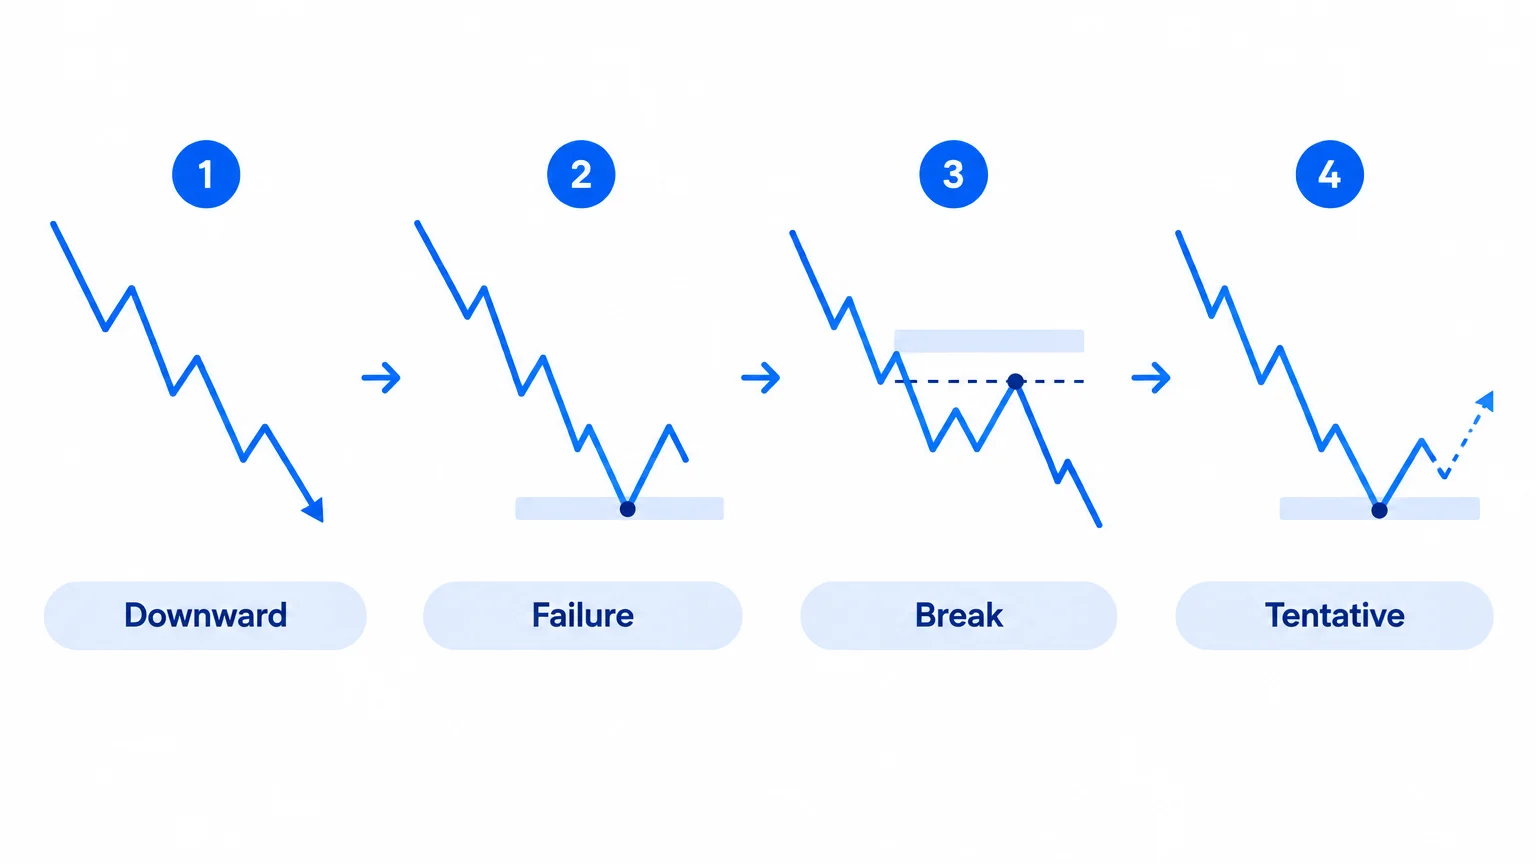
Imagine a fictional decline with lower highs and lower lows. Price then fails to extend below its latest low and begins to recover. At this stage, the decline may be losing momentum, but an upward trend has not automatically been established.
If price moves beyond a meaningful lower high, the downward sequence is challenged. A subsequent pullback that holds above the prior low can add evidence for a transition. A failure back below the low weakens that interpretation.
This is a sequence of conditional observations, not a guaranteed reversal recipe. Events, liquidity and a larger timeframe can all affect the outcome. The purpose is to avoid jumping from one encouraging candle to an unsupported trend declaration.
Align context and execution
Use the broader chart to identify the environment and the working chart to define the setup. State the relationship explicitly: for example, a short-term recovery within a larger range. This is more informative than forcing every timeframe into the same directional label.
If the timeframes conflict, decide whether your method allows the trade and what limits apply. Do not switch to another chart solely to find confirmation. The trading chart workflow provides a sequence for maintaining that discipline.
Tie structure to invalidation and objectives
A structure-based scenario needs a reference whose failure matters. If an upward continuation depends on a defended higher low, explain what behavior below it would undermine the thesis. The invalidation-level guide separates that analytical condition from the protective order.
Objectives should also reflect structure. A prior swing or range boundary may be a relevant obstacle. A target beyond several unresolved areas requires more explanation than a simple measured distance on the chart.
Do not let structural language obscure the cash risk. A logically placed stop can still create an oversized monetary exposure if the position is too large or the product multiplier is misunderstood.
Watch for hindsight in back-review
When reviewing a historical example, hide later candles if possible and record the structure using only the information available at that point. Then reveal the next segment. This exercise exposes how often a clear-looking historical reversal was ambiguous while forming.
Track ambiguous and failed cases, not just textbook examples. A method that cannot describe uncertainty will tend to overstate its usefulness. Your notes should allow “range,” “transition unclear” and “insufficient context” as legitimate conclusions.
AI can help summarize visible swings, but verify the annotations. A model may overemphasize the latest bars or use a different swing sensitivity from yours. Specify the rule before asking for a structural interpretation.
Distinguish a structural level from a precise fill
A swing may define an important area without specifying an executable order. The analytical question is whether the structure remains intact; the execution question includes spread, available liquidity and the price accepted by the order. Mixing them can make a method look cleaner on a historical chart than it is in practice.
For review, record both the structural reference and the actual order assumption. If a strategy waits for a close beyond the reference, do not backtest it as though entry occurred at the reference before the close. That would use information unavailable at the assumed entry time. This simple timing check is particularly valuable when evaluating annotated examples that show perfect turns and precise labels after the full move has already developed.
Key takeaways
- Structure depends on timeframe and swing definition.
- A small break does not automatically reverse a larger trend.
- Ranges and uncertain transitions are valid classifications.
- Confirmation has a timing cost and can still fail.
- Review structure using information available before the outcome.
Frequently asked questions
Are higher highs enough to call an uptrend?
Not by themselves under many methods. Examine the intervening lows, the significance of the swings and the broader context. One brief new high can occur inside a range or before a failed breakout.
What is the difference between a pullback and a reversal?
A pullback moves against an existing direction without necessarily invalidating its structure. A reversal implies a more meaningful directional change. The distinction requires a stated timeframe and failure condition, not hindsight alone.
Must a breakout retest its old boundary?
No. Some moves continue without a clear retest, while others return and fail. A strategy can require a retest as an entry condition, but that is a rule for participation rather than a requirement imposed on the market.
Can market structure work without indicators?
It can be described directly from price. Indicators may add context, but they do not remove the need to define swings and timeframes. Choose additional tools only when they answer a specific question.
Why do analysts disagree about the same chart?
They may use different swing sensitivity, timeframes or confirmation rules. Compare those definitions before comparing their conclusions. Some disagreement also reflects genuine ambiguity in the available evidence.
Conclusion
Market structure provides a language for conditional reasoning. Define the swings, identify the context and state what would change the interpretation. A clear description of uncertainty is more useful than attaching a confident trend label to every chart.
Prepared with AI assistance
Keep exploring
 Technical Analysis
Trading Chart Analysis: A Practical Decision-Making Guide
Build a repeatable chart analysis process using market structure, meaningful levels, conditional scenarios and realistic risk and...
Read article Technical Analysis
Support and Resistance: Finding Important Price Levels
Identify meaningful support and resistance zones, assess how price responds and define failure conditions without treating chart l...
Read article Technical Analysis
Gold Technical Analysis: How Traders Analyze XAU/USD
Review gold and XAU/USD charts with a clear process for structure, macro context, product specifications and risk, without assumin...
Read article