Gold Technical Analysis: How Traders Analyze XAU/USD
Review gold and XAU/USD charts with a clear process for structure, macro context, product specifications and risk, without assuming a current trade signal.
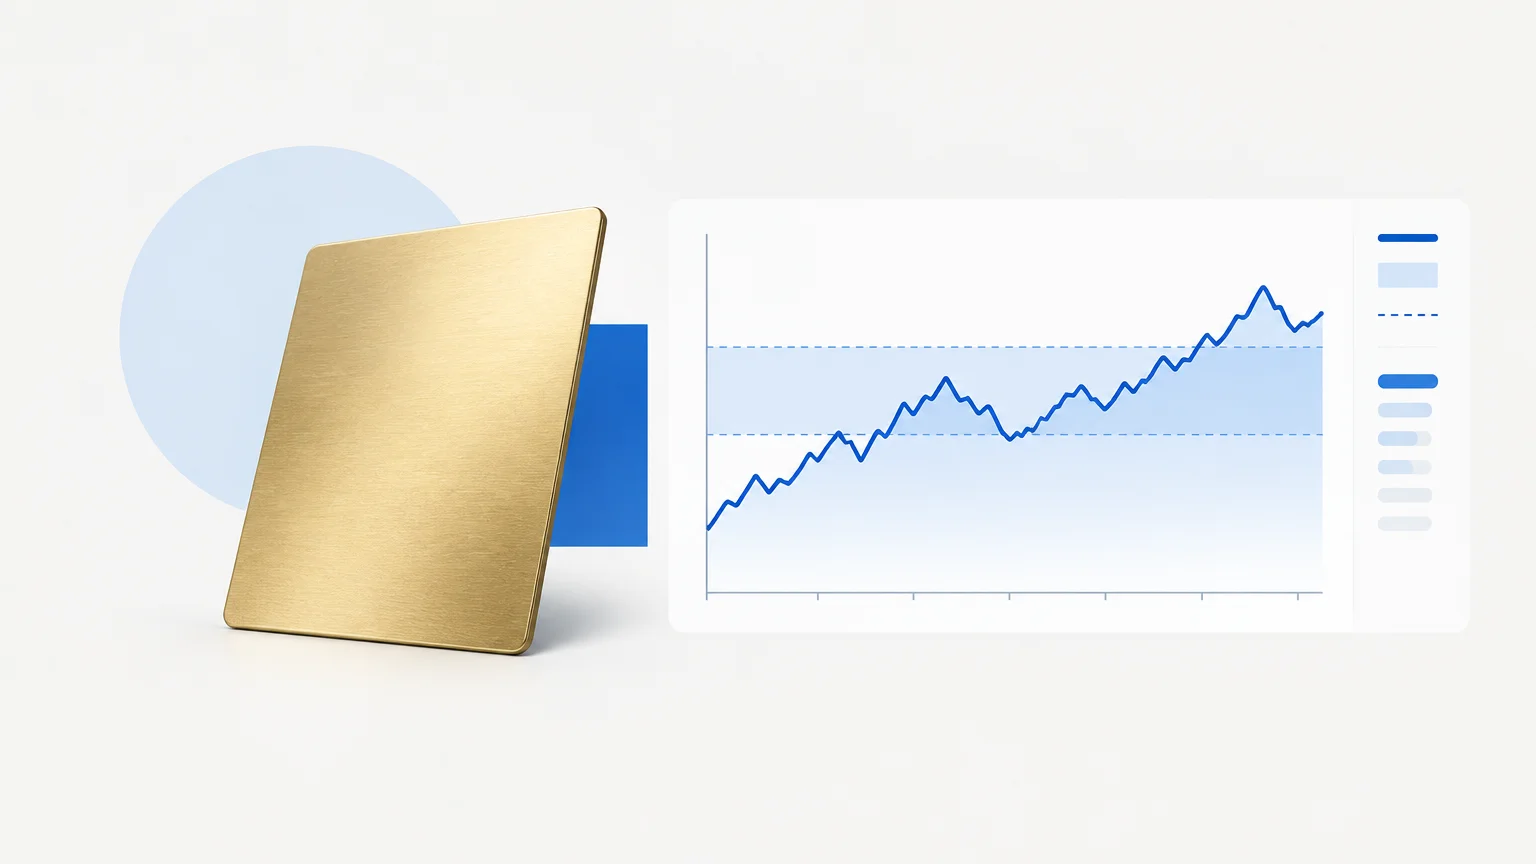
Gold technical analysis examines how a particular gold-related instrument is trading. The phrase XAU/USD usually refers to gold quoted in US dollars, but the symbol alone does not tell you the product's contract size, financing or execution rules. A chart can look familiar while representing a materially different exposure.
Begin with the instrument, then the structure. Gold's reputation as a defensive asset does not mean its price cannot fall sharply or that an individual leveraged position is protected from loss.
Identify the gold product
Distinguish a broker-quoted XAU/USD product from a listed future, an exchange-traded fund or physical metal. Each can involve different costs, hours, multipliers and sources of price data. The chart's visual pattern does not erase those differences.
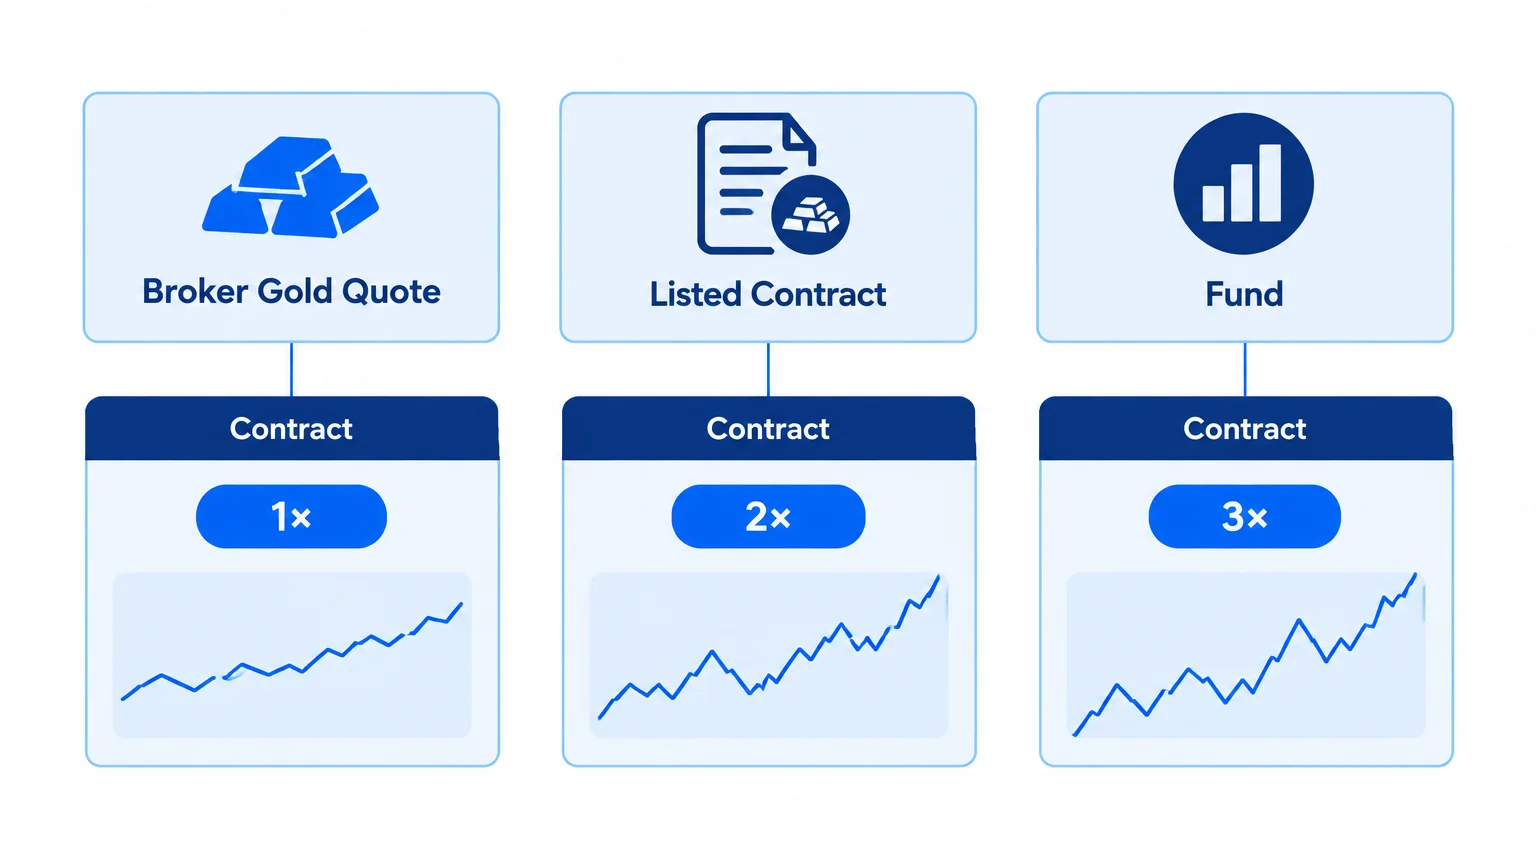
If using futures, check the contract month and whether the displayed history is a continuous series. Adjustments and contract transitions can affect how historical levels appear. Verify specifications directly with the venue; CME's gold futures product page is one primary reference for its listed products.
Never import a lot-size assumption from another broker. Confirm the value of a price move for the exact position you intend to assess.
Map the broader structure
Use a chart that shows enough history to identify major swings and the current location within them. Is price advancing, declining or overlapping? Is it approaching a prior extreme, retesting a boundary or moving through the middle of a range?
The market-structure guide provides a consistent vocabulary. Avoid describing every sharp gold move as a new trend before checking its relationship to the broader chart.
Then select a working timeframe that matches the intended holding period. A short-term pullback and a longer-term upward structure can coexist. State both rather than forcing a single label onto all horizons.
Use zones and volatility together
Mark the nearest meaningful support and resistance areas. Large wicks and fast reactions can make exact lines less defensible than zones. Define how you will judge acceptance beyond a zone or rejection from it.
Consider the recent scale of movement. A stop distance that was outside ordinary fluctuations in one period may sit inside routine movement in another. This is a reason to reassess the method and size, not to widen risk without a limit.
The guide to support and resistance explains why the area's response matters more than the label attached to it.
Add macro context carefully
Gold analysis often examines the dollar, interest-rate expectations, inflation context and demand for defensive assets. These relationships can change and interact. Avoid a mechanical claim that one variable always determines gold's next move.
If you reference a current policy event or yield change, verify its source and timestamp. A chart screenshot does not supply the entire macro picture. A model should not invent a news explanation because the candle looks dramatic.
The forex analysis framework provides useful context for thinking about relative currency movements, while recognizing that a gold product has its own specifications and risks.
Prepare for event-driven movement
Identify scheduled releases that could affect the intended holding period and verify their timing. Decide whether the setup is designed to remain active through such events. A plan based on ordinary movement may not describe conditions during a sudden repricing.
Unscheduled events remain possible. The point of preparation is not to predict every catalyst but to avoid assuming the chart is the only source of risk. Liquidity, spreads and execution can change when the pace accelerates.
Check your actual platform rather than inferring current spread from a historical candle. A visually attractive entry can be economically different once the executable prices are considered.
A hypothetical gold-chart review
Imagine an illustrative XAU/USD chart approaching an upper range boundary after a strong advance. One scenario anticipates continuation if price remains accepted above the boundary. Another anticipates a failed break if it returns inside the range. A wait scenario covers continued overlap without a clear response.
Before choosing an entry, identify the nearest obstacle beyond the boundary and the condition that would invalidate the idea. If the required stop is wide relative to the available room, reduce the proposed exposure or reject the setup under the method's rules.
This example contains no current gold price. Its purpose is to show how location, response and exposure belong in the same analysis.
Calculate risk from contract specifications
The cash effect of a price move depends on the product multiplier and position size. A one-unit move on the chart is not automatically one unit of account-currency risk. Include currency conversion if the product and account currencies differ.
Use the position-sizing guide to organize the calculation. Confirm minimum increments and round in a way that does not exceed the intended risk budget. If the smallest permitted position is too large, the product may not fit the plan.
Do not confuse margin with risk. A relatively small margin requirement can support a position whose price movement creates a much larger loss. Planned exits also remain subject to execution uncertainty.
Avoid common gold narratives
Statements such as “gold must rise during uncertainty” can become substitutes for analysis. Markets respond to changing expectations, positioning and several simultaneous forces. A broad narrative does not define an entry, invalidation or holding period.
Likewise, a dramatic wick does not prove manipulation or reveal the identity of participants. Describe what is visible and label possible explanations as unverified unless supported by evidence.
TradingInte can help organize the chart into scenarios, but the product specification and source data still need independent verification. Treat a confident AI narrative as something to inspect, not a reason to skip those checks.
Compare charts without mixing instruments
When a gold chart disagrees with another source, first compare the products and settings. One may show a specific futures contract while another shows a broker quote or adjusted continuous history. Check timestamps, trading hours and the definition of the displayed series before concluding that a price level is incorrect.
Use cross-product charts as context only when the relationship is understood. An area visible on one series may not translate to the exact same order price on another. Record which source defines the analytical zone and which source defines execution.
This distinction also matters for screenshots sent to AI. Identify the product in the prompt and request that the model avoid assuming a multiplier from the symbol. If the image does not contain the specification, obtain it separately. The chart can support a structural observation while remaining insufficient for a complete cash-risk calculation.
Key takeaways
- Confirm which gold product the chart represents.
- Combine structure, location and the recent scale of movement.
- Treat macro relationships as context rather than mechanical laws.
- Verify event timing and executable spread.
- Calculate exposure using the actual multiplier and account currency.
Frequently asked questions
Is XAU/USD identical across all brokers?
No. Naming can be similar while contract terms, pricing and financing differ. Consult the specification for the exact instrument rather than relying on a generic lot-size rule.
Does gold always rise when stocks fall?
No relationship should be assumed to hold in every episode. Treat cross-market observations as context and examine the actual evidence rather than using a permanent one-direction rule.
Should gold stops be wider than forex stops?
There is no useful universal comparison without units, volatility and product specifications. Define the setup's invalidation and convert the distance into cash risk before comparing exposure.
Can I analyze gold without current news?
You can study historical structure, but a current decision needs acknowledgment of missing event context. Do not present a chart-only exercise as a complete live-market assessment.
Can an AI screenshot determine the correct lot size?
Not from the image alone unless all required specifications and risk inputs are supplied and verified. Chart distance is only one component of the calculation.
Conclusion
Gold technical analysis should connect the chart to the actual product being traded. Map the structure, verify relevant context and translate the scenario into cash exposure. A familiar symbol and a persuasive narrative are not substitutes for those steps.
Prepared with AI assistance
Keep exploring
 Technical Analysis
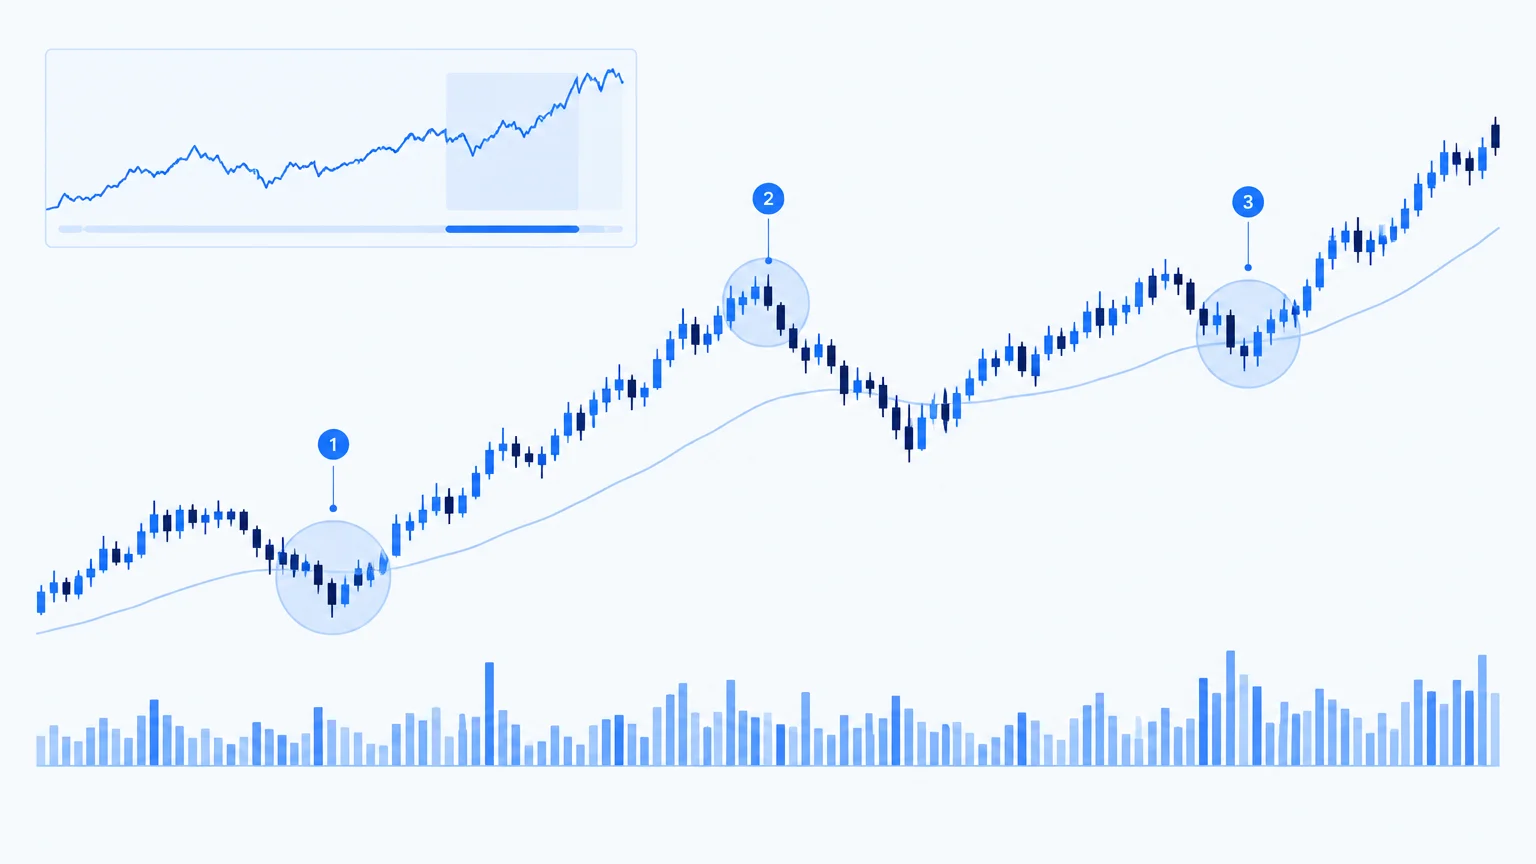
Trading Chart Analysis: A Practical Decision-Making Guide
Build a repeatable chart analysis process using market structure, meaningful levels, conditional scenarios and realistic risk and...
Read article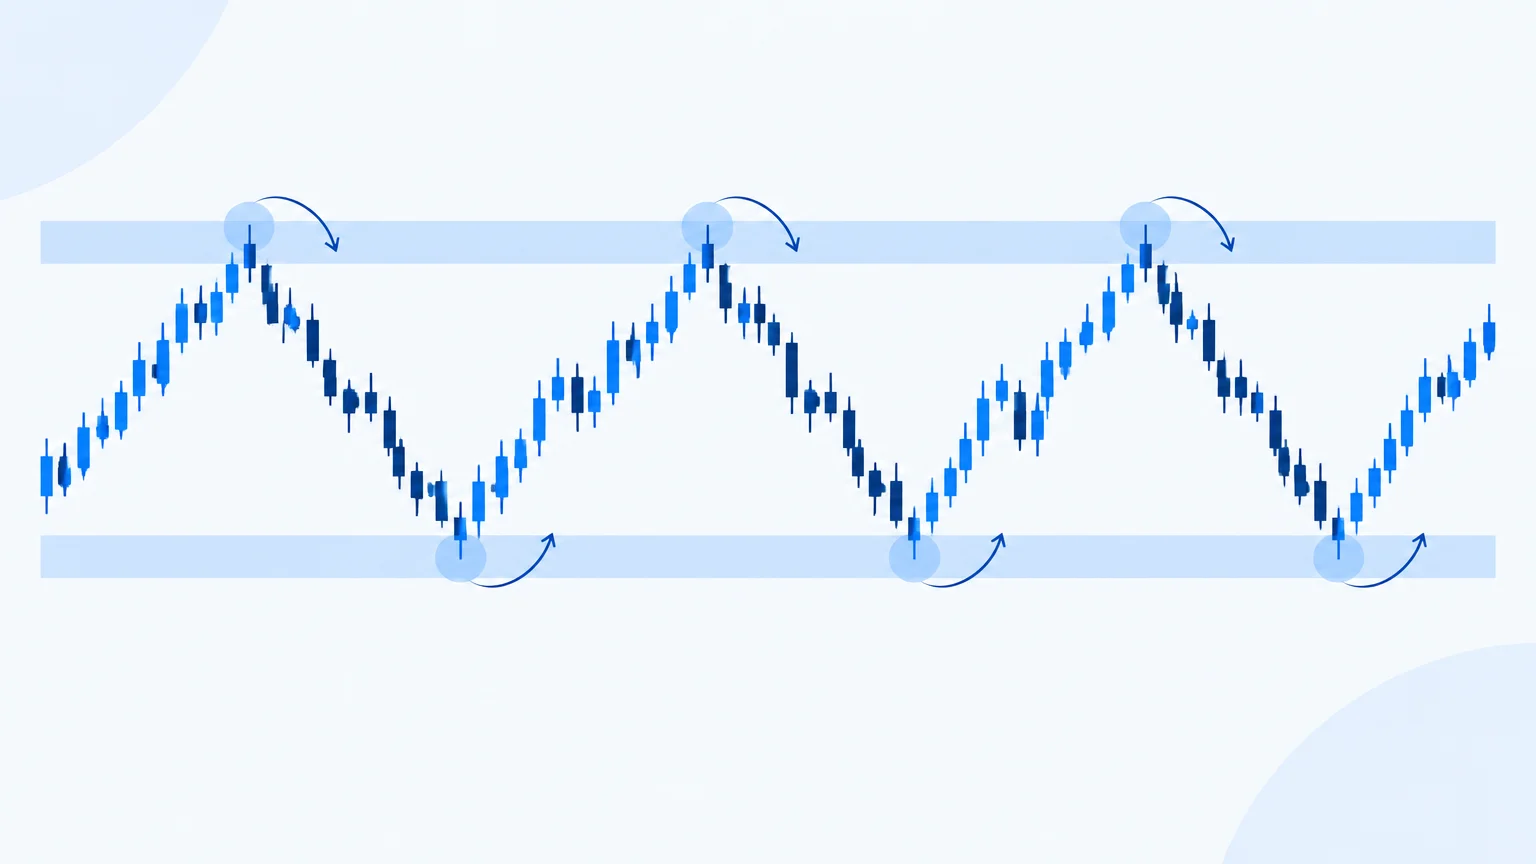 Technical Analysis
Support and Resistance: Finding Important Price Levels
Identify meaningful support and resistance zones, assess how price responds and define failure conditions without treating chart l...
Read article Technical Analysis
Market Structure in Trading: Trends, Breakouts and Reversals
Read market structure through swings, trends, ranges and transitions. Define confirmation, invalidation and timeframe without rely...
Read article