Forex Technical Analysis: Reading Currency Market Structure
Analyze currency pairs using structure, levels, sessions and verified event context while checking pip values, contract specifications and execution risk.
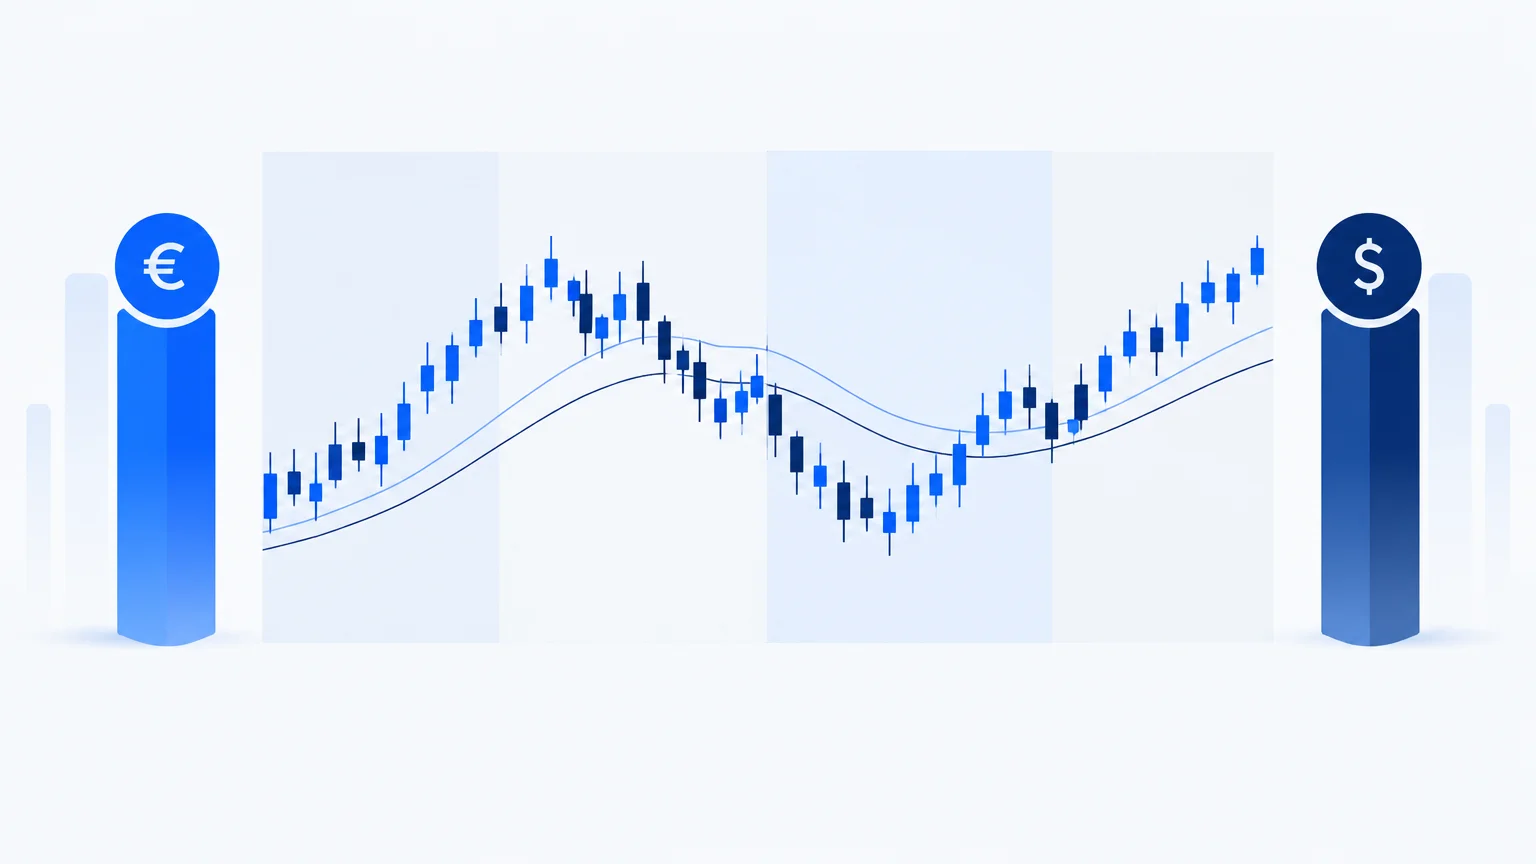
Forex technical analysis examines the price of one currency relative to another. That relationship matters: an upward move in a pair is strength in the base currency relative to the quote currency, not proof that either currency is strong against every other currency.
The chart can help organize trends, ranges and reaction areas, but currency trading also requires attention to sessions, economic events, spread and product specifications. A familiar-looking pattern does not make those mechanics optional.
Read the pair correctly
In a pair written as EUR/USD, the euro is the base currency and the dollar is the quote currency. The price expresses the amount of quote currency for one unit of base currency. Before making a directional statement, identify which side of that relationship you mean.
Confirm the exact product. A broker's rolling spot-style product, a currency future and another derivative can have different contract terms, financing and execution conditions. Do not transfer a position-size calculation from one product to another based only on the currency names.
The EUR/USD analysis guide applies this framework to a specific pair without relying on a current price call.
Confirm the feed and timeframe
Different providers can show slightly different quotes or session conventions. Record the broker or data source, timezone and whether the latest candle is complete. A daily close can differ across feeds because the day is defined differently.
Use a broader chart for context and a working chart for the decision. A short-term recovery may exist inside a longer decline. Describe that relationship instead of treating it as a contradiction that must be eliminated.
The market-structure framework helps define swings and transitions consistently. It also prevents a small local break from being exaggerated into a major change of trend.
Map the relevant currency structure
Identify the nearest meaningful swing zones and any clear range. Consider where the current price sits: near an edge, in the middle or extended beyond recent structure. A directional opinion without location can overlook how little room remains before an opposing area.
Use support and resistance as a map for observation. Do not assume a boundary must hold because it has been tested before. Define what acceptance beyond the area would mean for the scenario.
If a chart contains repeated crossings and overlapping bars, acknowledge the uncertainty. There is no requirement to produce a directional trade idea during every review.
Understand the role of sessions
Activity can change as major financial centers open, overlap or close. Holidays and unusual events can alter the usual pattern. Rather than assuming one session always behaves a certain way, inspect the actual spread, pace and available liquidity for the product.
Match the setup to the period you can monitor. An intraday idea formed during an active session may not behave the same way during a quieter interval. A broader setup still needs an execution plan for the time at which an order will be placed.
Keep session observations descriptive. “The recent bars are larger and the spread is wider” is something you can verify. “This session always breaks out” is an unsupported generalization.
For related dollar-sensitive research, the gold and XAU/USD analysis guide explains why chart concepts can transfer while product multipliers and market drivers still require a separate assessment. A shared quote currency does not make two exposures identical.
Add economic events without inventing causality
Interest-rate decisions, inflation releases and employment reports can affect currency expectations. Verify the date, time, timezone and source of any event relevant to the intended holding period. A screenshot does not provide a complete calendar.
After a release, distinguish the actual data from the market reaction. Price can respond to the difference from expectations, revisions or accompanying commentary. Avoid assuming that a numerically stronger release must produce one direction in the pair.
If you cannot verify current context, state that the analysis is chart-based and incomplete. AI should help identify the missing question rather than supply an invented explanation for the latest candle.
Treat volume carefully
A currency chart may show tick activity from a particular source rather than a complete measure of global spot-market transactions. Understand what the platform's field represents before interpreting it as market-wide participation.
You can still use source-specific activity within a defined method, but the claim should match the data. Do not describe it as total global buying or selling merely because the panel is labeled volume.
The same principle applies to any indicator: know the input and formula before treating its output as independent evidence.
A hypothetical pullback review
Imagine a pair with an upward sequence on a broader chart and a pullback toward a prior breakout area on the working chart. The research question is whether the area remains accepted, not whether every touch should be bought.
Write a condition for continuation, a condition for failure and a wait condition for overlapping movement. Then check the nearest obstacle and the spread. If a major release is imminent, decide whether the method permits carrying the scenario through it.
No current exchange rate is required for this exercise. It demonstrates the order of decisions: context, location, behavior, risk and execution.
Calculate exposure using the actual contract
Pip value depends on position size, pair conventions and account currency. Contract sizes and minimum increments can vary by product. Verify the broker's specification rather than using a memorized shortcut outside its assumptions.
Margin describes a financing requirement, not the maximum possible loss. The position-sizing guide explains how to connect stop distance with a monetary risk budget while accounting for the relevant units.
Also consider correlated exposure. Several pairs can share the same currency driver. Treating each position as independent may understate the concentration in one underlying view.
Check the account-currency assumption
A currency-pair calculation can look correct while reporting risk in the wrong currency. Write the quote currency, account currency and conversion assumption beside the result. If conversion is required, use an appropriate verified rate for the calculation and recognize that it can change.
This matters when comparing positions across several pairs. Equal lot sizes do not necessarily create equal cash risk, and equal stop distances in pips do not necessarily do so either. Compare the monetary estimate after the relevant conversion, then examine shared currency exposure.
Keep a worked example from the actual broker specification as a reference. Reuse the method rather than a memorized final number. If a contract term changes or a different account is used, update the reference before applying it. A small units check can prevent a much larger sizing error than a minor disagreement over the chart’s next swing.
Key takeaways
- Interpret the base and quote currencies correctly.
- Record the feed, timezone and decision timeframe.
- Combine structure with session and event context.
- Identify what the volume field actually measures.
- Use real contract specifications for exposure calculations.
Frequently asked questions
Is forex technical analysis different from stock analysis?
The descriptive chart concepts overlap, but mechanics differ. Currency pairs express relative values and have their own sessions, financing and contract conventions. Company earnings research does not transfer directly to a currency pair.
Can I ignore economic news if I use charts?
That would leave an important source of execution uncertainty unexamined. Even a purely technical method needs a policy for known events that can materially change volatility or spreads.
Is a pip worth the same amount on every pair?
No. Its monetary value depends on the instrument, size and currency conversion. Verify the actual specification and account currency before calculating exposure.
Does tick volume show all forex activity?
It generally represents activity available from the relevant source, not a complete global transaction record. Interpret it within those limits and avoid claims the data cannot support.
Can AI analyze a currency screenshot?
It can help describe visible structure if the pair, timeframe and scales are legible. It cannot infer a complete live calendar or execution spread from an image that does not contain that information.
Conclusion
Forex technical analysis is strongest when the chart and product mechanics are considered together. Define the relative currency view, map the structure, verify events and calculate exposure correctly. A clean setup still needs a realistic execution plan.
Prepared with AI assistance
Keep exploring
 Forex
EUR/USD Analysis: What to Examine Before Trading the Pair
Build an evergreen EUR/USD review using chart structure, relative currency context, event checks and exposure calculations without...
Read article