Support and Resistance: Finding Important Price Levels
Identify meaningful support and resistance zones, assess how price responds and define failure conditions without treating chart levels as guarantees.
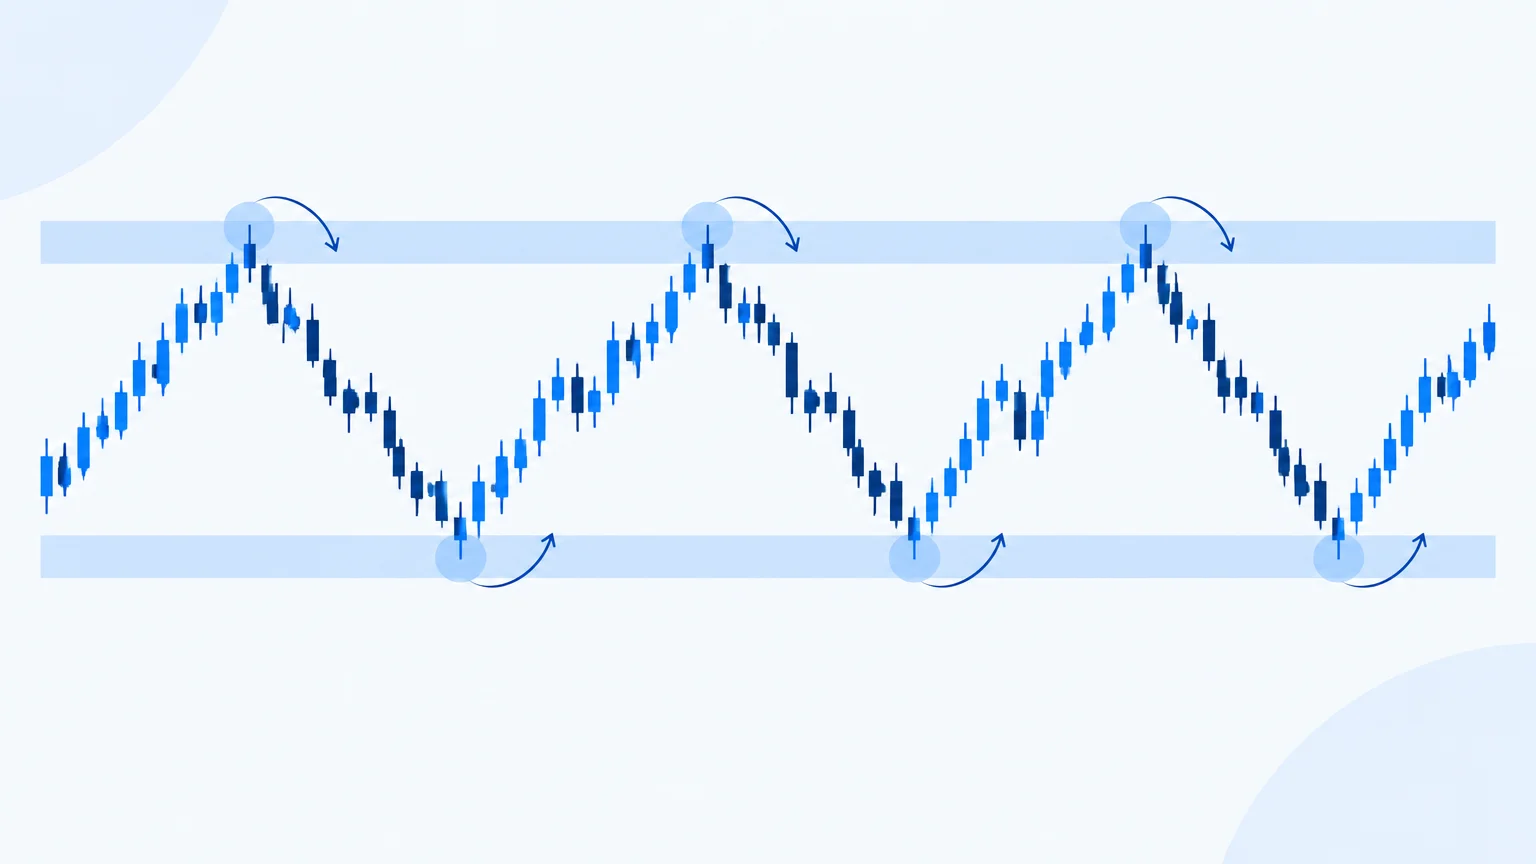
Support and resistance describe areas where price has previously met a meaningful response. Support is associated with buying interest or reduced selling pressure; resistance is associated with selling interest or reduced buying pressure. These labels describe observed behavior. They do not establish that orders remain at a level or that the next test must produce the same response.
The practical skill is selecting a few areas that matter to a specific decision. A chart covered with lines can explain almost any outcome afterward. A useful map tells you where you will pay attention, what behavior you expect to examine, and what would make the area irrelevant.
Start with visible evidence
Look for prominent swing highs and lows, repeated reactions, consolidation boundaries and important gaps. A swing that changed the direction of a substantial move often deserves more attention than a minor fluctuation inside congestion. Begin with the broader context, then refine on the timeframe used for the decision.
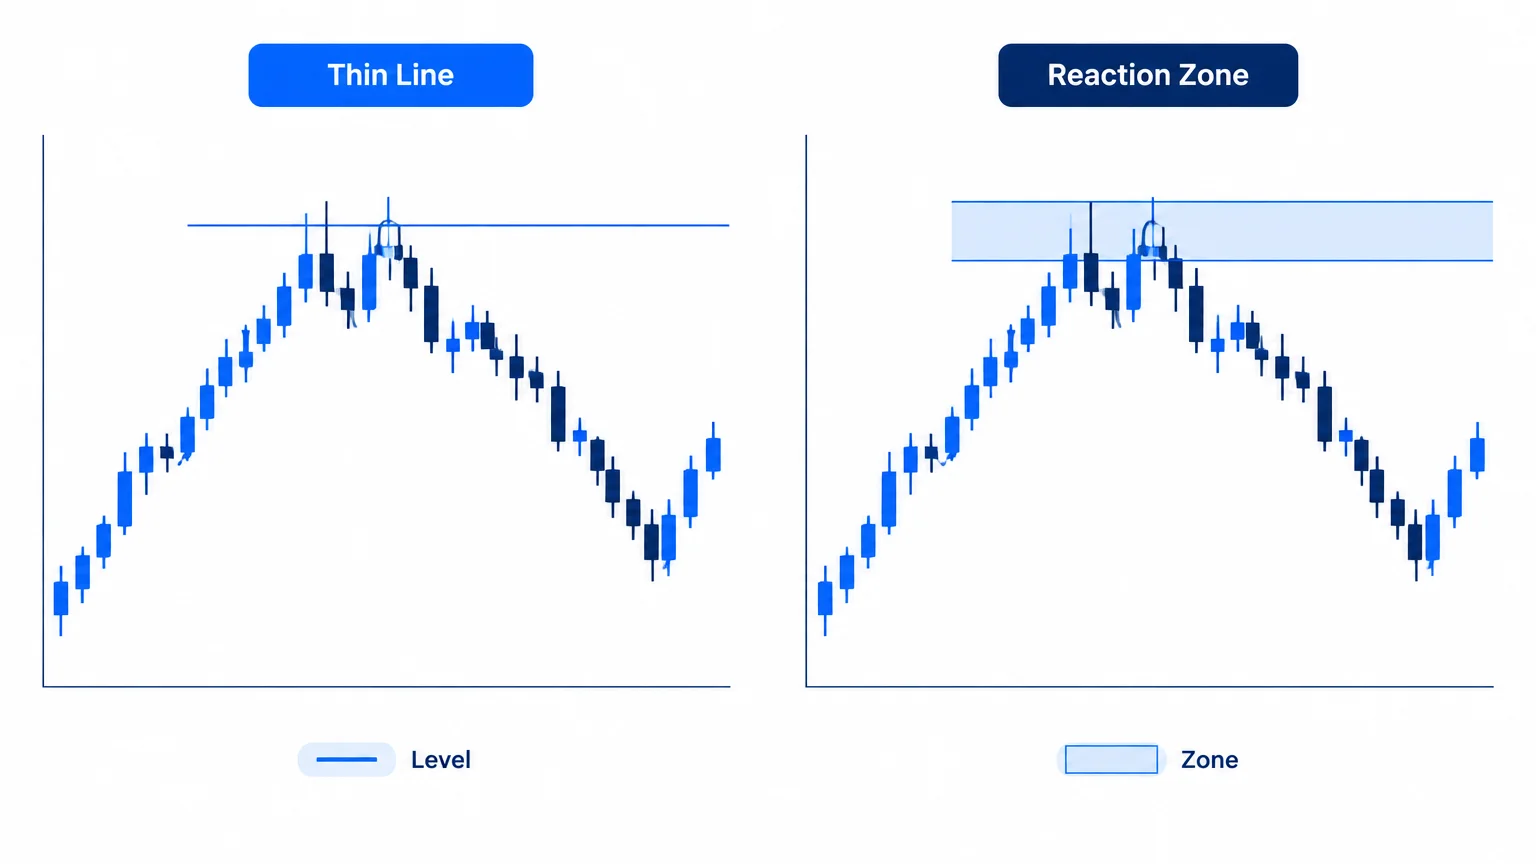
Write the reason beside each area. Examples include a prior daily high or the lower boundary of a multiday range. Avoid labels implying hidden knowledge, such as a precise institutional buying price, unless you have a separate source that actually supports the claim.
The guide to trading chart analysis explains how level selection fits into a wider review. Drawing lines is only one part of that process.
Why zones are often more useful than lines
Different participants use different prices, timeframes and order types. Wicks, closing prices and clusters of overlapping candles may outline an area rather than one exact threshold. A zone acknowledges that uncertainty while preserving a location to monitor.
Define the boundaries from the chart rather than expanding them whenever price moves against your interpretation. An area that grows indefinitely cannot be invalidated. If you use candle closes to judge acceptance or failure, specify the timeframe in advance.
An order ultimately requires an executable price, but that is a later decision. First identify the area and the behavior that would matter there. Then ask whether an entry, invalidation and objective can be arranged with acceptable risk.
Read the approach and the response
A support zone approached through a gradual, overlapping decline presents different evidence from one reached after a sudden gap. A resistance area tested during a strong expansion is different from one approached with shrinking movement. These differences help frame questions; they do not provide automatic answers.
Observe what happens after contact. Does price reject the area, pause, trade through it and return, or remain beyond it? A single touch is not necessarily a meaningful test. The response must be judged using the same timeframe and definitions that created the setup.
Do not assume that more touches always make a level stronger. Repeated tests can establish recognition, but they can also occur while the surrounding structure changes. The chart does not reveal how much resting interest remains available.
Role reversal requires evidence
Traders often watch former resistance as possible support after a breakout, or former support as possible resistance after a breakdown. This is a hypothesis about subsequent behavior, not a rule that activates the moment a price crosses a line.
A meaningful review asks whether price remains beyond the area, whether a retest is accepted, and whether the original range is reclaimed. The market-structure guide explains how these events connect to continuation and failed-break scenarios.
If the market crosses the area repeatedly without a clear response, it may no longer be useful for the decision. Removing a weak level is often more informative than adding another one nearby.
An illustrative range example
Imagine a fictional instrument repeatedly trading between a lower zone and an upper zone. In the middle, either boundary is relatively far away, while the immediate direction remains unclear. At the lower boundary, a trader can ask whether rejection supports another rotation upward. Beyond the upper boundary, the question becomes whether price is establishing a new area of acceptance.
These are different setups and should not share an improvised entry rule. Buying simply because price is “at support” omits the response, the invalidation and the available room. Likewise, buying a move above resistance without checking whether the candle has closed can confuse a brief excursion with a sustained break.
The example is deliberately price-free. The reasoning depends on relative location and behavior, not on fabricated quotes or an implied current market opportunity.
Connect levels to invalidation
An area matters to a trade only if it helps define when the scenario no longer makes sense. If the thesis is that buyers will defend a reclaimed boundary, sustained acceptance below that boundary may undermine it. Define what sustained acceptance means before entry.
Do not place a stop at the exact level solely because that makes the position larger. Normal movement and execution conditions can make a mechanically convenient stop inconsistent with the thesis. Read trading invalidation levels to separate the analytical condition from the order used to control exposure.
An analytical invalidation is not a promise about execution. A market can gap beyond it, and a stop order may fill at a different price. Your size and event policy need to account for that possibility.
Avoid common level-selection mistakes
One mistake is using hindsight to select only the lines that worked. Another is switching between wicks and closes whenever one better fits the desired interpretation. A third is treating a small intraday area as decisive against a much larger structure without explaining the timeframe difference.
Keep a chart saved before the test and compare the outcome with your original map. Track areas that failed as well as those that reacted. This makes the review more honest and helps reveal whether the selection method is consistent.
Also distinguish a reaction from a tradable opportunity. Price may move briefly away from a level but offer insufficient room after spread, fees and the required stop distance. The entry-zone framework connects the visual area to that practical decision.
A concise preparation routine
Start with three questions: where is price within the larger structure, which nearby area could change the interpretation, and what response would matter there? Remove levels that do not help answer one of those questions.
Then write both sides of the scenario. If the area holds under your chosen definition, what remains plausible? If it fails, what changes? Include a wait condition for overlapping behavior. This prevents a level map from becoming a reason to trade every touch.
Distinguish a map from a forecast
Your marked areas tell you where to investigate a response. They do not tell you in advance which response must occur. Keeping that distinction explicit makes it easier to remove a level that no longer helps and to avoid treating every nearby candle as confirmation.
Key takeaways
- Support and resistance are observed reaction areas, not guarantees.
- Use zones when the chart does not justify exact precision.
- Judge the approach, response and surrounding structure together.
- Define failure before using a level for an entry.
- Keep records of failed areas as well as successful reactions.
Frequently asked questions
How many levels should I draw?
Use the few that affect your decision. A broader reference, the nearest opposing area and the level tied to invalidation may be enough. Extra lines should answer a question rather than merely fill empty space.
Are round numbers always support or resistance?
They may attract attention, but the number alone is weak evidence. Look for actual price behavior around the area. Do not assume that a visually neat price must produce a tradable reaction.
Should I use wicks or candle closes?
Either can be part of a defined method. Wicks describe the full range; closes describe where the period ended. State the rule and apply it consistently instead of changing it after the outcome.
What is a false breakout?
It is a move beyond a boundary that fails under the method's definition and returns to the prior structure. The definition should specify timeframe and confirmation; a brief crossing alone does not settle the question.
Can AI find these zones for me?
It can suggest visible areas, but you should verify the evidence and scale. Ask why each zone matters and what would invalidate it. Reject levels that rely on unreadable numbers or unsupported claims about hidden orders.
Conclusion
Useful support and resistance analysis creates a focused map of decisions. Mark the evidence, define the expected response and specify failure. The quality of the map is measured by how clearly it guides review, not by how many historical turns a line can touch.
Prepared with AI assistance
Keep exploring
 Technical Analysis
Trading Chart Analysis: A Practical Decision-Making Guide
Build a repeatable chart analysis process using market structure, meaningful levels, conditional scenarios and realistic risk and...
Read article Technical Analysis
Market Structure in Trading: Trends, Breakouts and Reversals
Read market structure through swings, trends, ranges and transitions. Define confirmation, invalidation and timeframe without rely...
Read article Technical Analysis
Gold Technical Analysis: How Traders Analyze XAU/USD
Review gold and XAU/USD charts with a clear process for structure, macro context, product specifications and risk, without assumin...
Read article