Trading Chart Analysis: A Practical Decision-Making Guide
Build a repeatable chart analysis process using market structure, meaningful levels, conditional scenarios and realistic risk and execution assumptions.
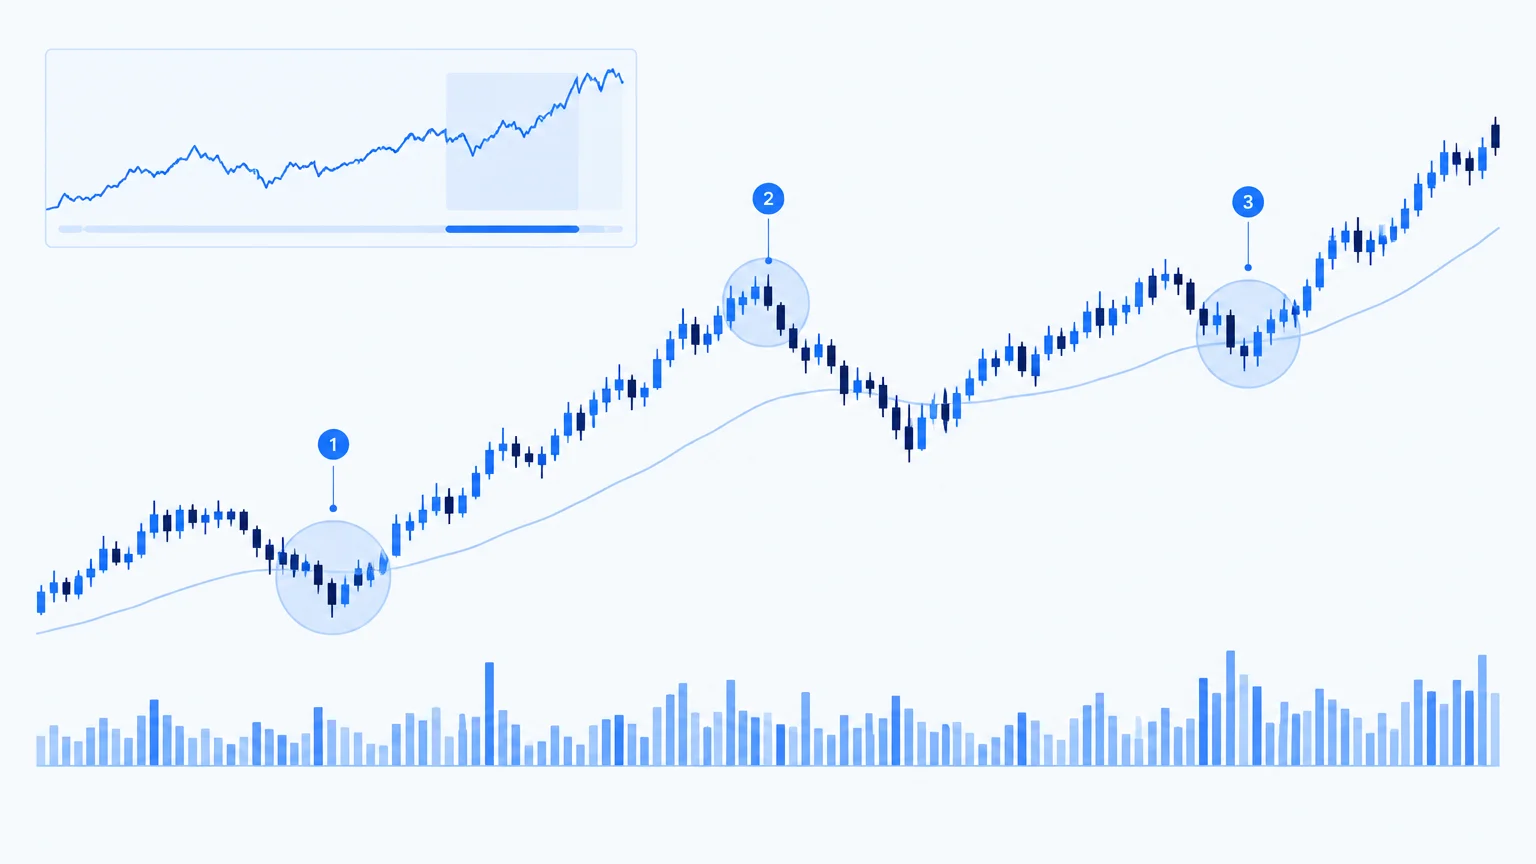
A chart compresses transactions into a visual record. It does not reveal every participant's intention, every pending order or the next headline. Trading chart analysis is the process of extracting a useful description from that limited record and deciding what evidence would justify changing it.
The challenge is rarely a shortage of patterns. It is choosing which observations matter for the decision in front of you. A repeatable process helps prevent the chart from becoming a canvas for whichever explanation feels convincing that day.
Define the decision before opening the chart
Write down the instrument and intended holding period. A chart used to assess a multiweek trend serves a different purpose from one used to examine an intraday entry. Decide whether you are researching a new idea, monitoring an existing scenario or reviewing a completed trade.
This distinction changes the questions. Research asks where opportunity might develop. Monitoring asks whether the original conditions still hold. Review asks whether your process was followed using information available at the time. Mixing these tasks invites hindsight and unnecessary changes to a plan.
If basic terminology is unfamiliar, start with technical analysis for beginners, then return to this practical sequence.
Confirm what the chart represents
Check the symbol, exchange or broker, session settings, timezone and price scale. On equities, determine whether historical prices reflect corporate-action adjustments. On currencies and digital assets, distinguish the exact instrument and venue rather than treating similarly named charts as identical.
Know whether the chart uses ordinary candles, a line, or a transformed representation. Some chart types smooth or reconstruct prices. They can help reveal patterns, but the displayed value may not represent a price at which an order could have executed.
Also check whether the last bar is complete. An interpretation based on a completed close is different from one based on a price that briefly traded through a level during a still-open bar.
Read from context toward detail
Use a broader timeframe to identify the surrounding structure, then a decision timeframe to examine the setup. An optional lower timeframe can help inspect execution detail. More views are not automatically better; too many can supply a justification for any bias.
Describe the larger chart in plain language. Is price progressing through higher swings, lower swings or an overlapping range? Is the current location near an edge, in the middle, or extended beyond recent structure? These observations establish context before indicators compete for attention.
The market-structure framework explains why a small break inside a range should not automatically be treated as a reversal of the larger trend.
Mark a few meaningful areas
Identify the nearest relevant support and resistance, a recent swing that matters to your scenario, and any obvious gap or consolidation boundary. Keep the chart sparse enough that a reaction has a clear interpretation.
A level deserves a reason. “Prior weekly high” is a reason you can verify. “Strong institutional level” is not sufficiently specific unless supported by additional evidence. Marking every visible turn makes it easy to claim the market respected a level after the fact but difficult to make a decision beforehand.
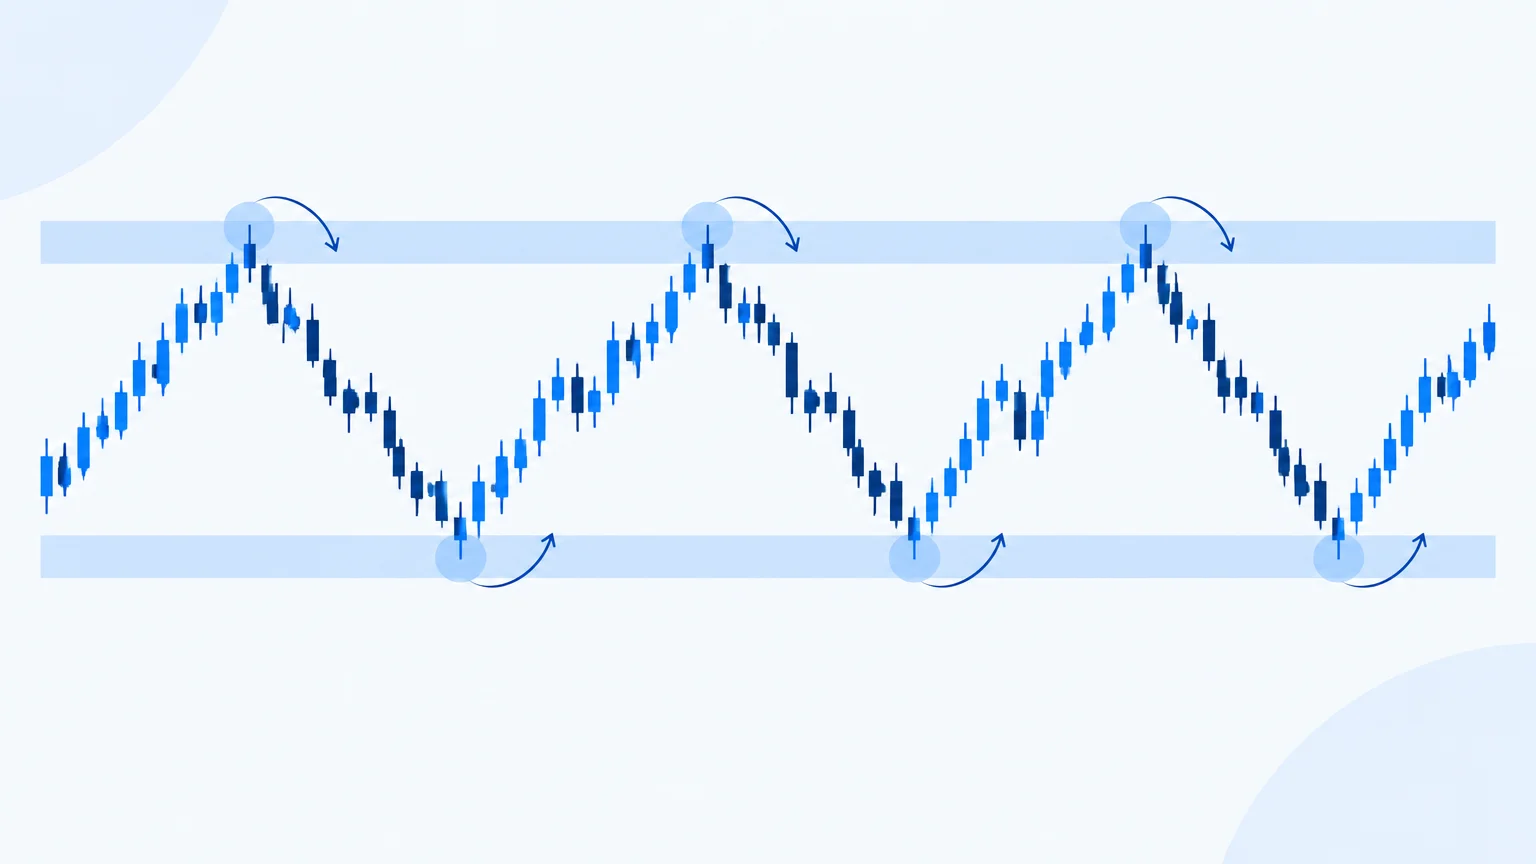
Think in zones when the chart contains a cluster of reactions. Define how you will judge whether a zone held or failed. The support-and-resistance guide develops this distinction without treating any line as a barrier price cannot cross.
Examine movement into the area
Location and approach work together. A slow, overlapping move toward resistance presents different evidence from a rapid expansion through it. Neither guarantees the next outcome. They simply provide different questions about momentum, acceptance and the possibility of a retracement.
Observe candle size relative to the surrounding bars, the amount of overlap and how price closes within its recent range. If volume is meaningful for the instrument and feed, examine participation too. Avoid importing conclusions from centralized stock volume into a broker-specific currency volume display without understanding the difference.
Build an if-then scenario
A usable scenario contains a condition, an interpretation and a point of failure. For example: if price holds above a reclaimed range boundary on the decision timeframe, an upward continuation remains plausible; if it returns inside and fails to reclaim the area, that scenario weakens.
Notice what this does not say. It does not require immediate entry, assert a probability or promise that the next swing will reach a target. Those are separate questions. The scenario simply connects observable behavior to a research conclusion.
Write a wait condition too. If price remains in the middle of an overlapping range, you may have no useful asymmetry. Naming that condition in advance makes inactivity a deliberate decision rather than a failure to find a pattern.
Connect the scenario to practical risk
An entry makes sense only in relation to invalidation, available room and costs. If the nearest obstacle is too close, a technically coherent scenario may still be unattractive. A risk/reward calculation should use the entry you could actually obtain, not the ideal price visible earlier in the chart.
Consider liquidity and events. A scheduled release can produce a gap or rapid movement through an exit level. A chart alone cannot tell you whether the spread is currently acceptable or whether a specific order will fill as expected. Confirm those details using your execution platform and relevant calendar.
Review without rewriting the past
Save a chart with your levels and scenario before the outcome. Later, compare what happened with the conditions you wrote. Did the setup trigger? Did you change the level after entry? Was the result affected by a cost or event you had ignored?
Separate process quality from the single outcome. A disciplined plan can lose, and an impulsive decision can make money. Review a consistent sample using the same definitions before drawing conclusions about a method. Do not change every rule after one disappointing trade.
TradingInte can help structure this record, but your source chart and written assumptions remain essential. Keep the original input so a later review does not depend on memory.
Use a stopping rule for research
Set a point at which more chart inspection is unlikely to change the decision. If the relevant area, failure condition and available room are already clear, adding another indicator can become a search for reassurance. If the inputs remain inadequate, identify the missing information and stop until it is available. This keeps research proportional to the question and reduces the temptation to convert uncertainty into action simply because you have spent time analyzing it. A useful note can end with a scheduled review condition instead of an entry.
Key takeaways
- Define the decision and timeframe before looking for a pattern.
- Confirm the instrument, chart type and session settings.
- Mark only levels that have an observable reason.
- Write a failure condition and a wait condition.
- Review the process using records made before the outcome.
Frequently asked questions
How many timeframes should I use?
Use enough to distinguish context from the decision, often a broader view and one main working view. Add another only if it answers a specific execution question. More timeframes can create conflicting signals without adding useful information.
Are candlestick patterns sufficient on their own?
Usually they need context. The same candle shape can appear at a range edge, in the middle of congestion or during a news event. Its location and the condition that follows matter more than the name alone.
Should every level use a precise price?
Execution orders need prices, but analysis often begins with zones. Define the zone from visible structure, then separately decide whether an executable trigger and risk limit can be constructed around it.
What if the chart looks unclear?
Reduce overlays, widen the context and state what is uncertain. If the result remains ambiguous, waiting is a valid conclusion. The chart does not owe you a setup on every review.
Can I use this process for several markets?
The sequence transfers, but instrument mechanics do not. Sessions, volume, contract size, funding and order behavior differ. Learn those details before applying the same visual interpretation to a different product.
Conclusion
Trading chart analysis becomes more useful when it produces a short, falsifiable plan. Identify the context, mark the relevant areas, define the conditions and assess the risk. A clean chart and a clear reason to wait are often better than a crowded chart full of possibilities.
Prepared with AI assistance
Keep exploring
 Technical Analysis
Support and Resistance: Finding Important Price Levels
Identify meaningful support and resistance zones, assess how price responds and define failure conditions without treating chart l...
Read article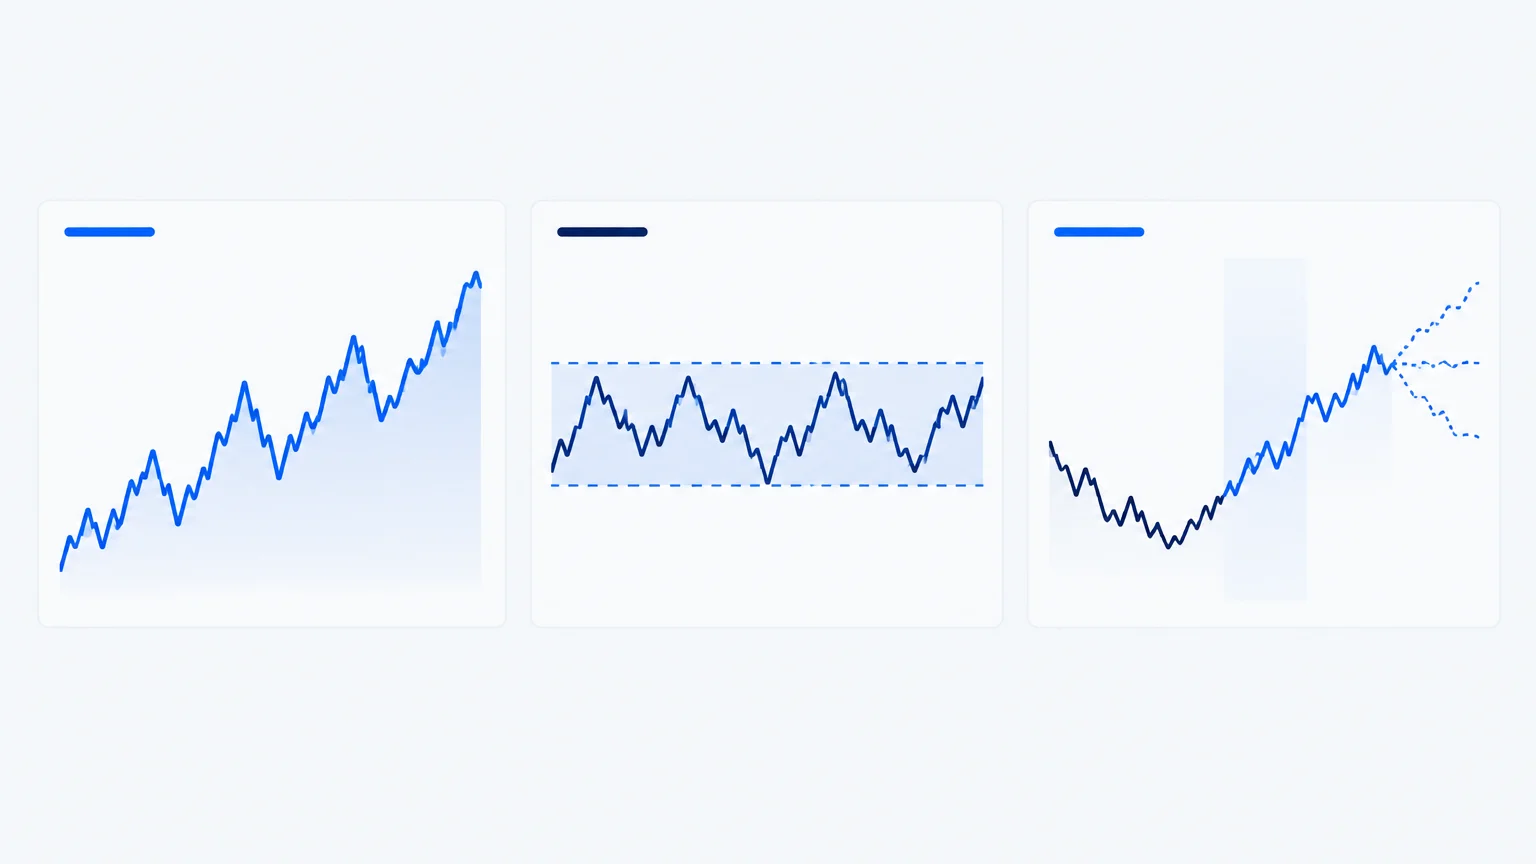 Technical Analysis
Market Structure in Trading: Trends, Breakouts and Reversals
Read market structure through swings, trends, ranges and transitions. Define confirmation, invalidation and timeframe without rely...
Read article Technical Analysis
Gold Technical Analysis: How Traders Analyze XAU/USD
Review gold and XAU/USD charts with a clear process for structure, macro context, product specifications and risk, without assumin...
Read article