Risk/Reward Ratio in Trading: Calculate It and Use It
Calculate trading risk/reward using real entry assumptions, understand R multiples and break-even arithmetic, and account for costs and partial exits.

A risk/reward ratio compares the loss planned for a trade with its potential favorable outcome. It is a useful arithmetic check, but it does not tell you how likely either outcome is. A distant target can create an attractive ratio on paper even when the chart offers little reason to expect price to reach it.
Use the calculation to test a coherent scenario, not to manufacture one. The entry, invalidation and objective should come from a defined process. Only then can the ratio help decide whether the available opportunity deserves further consideration.
Be explicit about the notation
Some traders write risk first, such as 1:2, while others describe the same relationship as a reward-to-risk multiple of 2. State which convention you use. In this guide, 1:2 means one unit of planned risk for two units of potential reward, and the corresponding reward multiple is 2R.
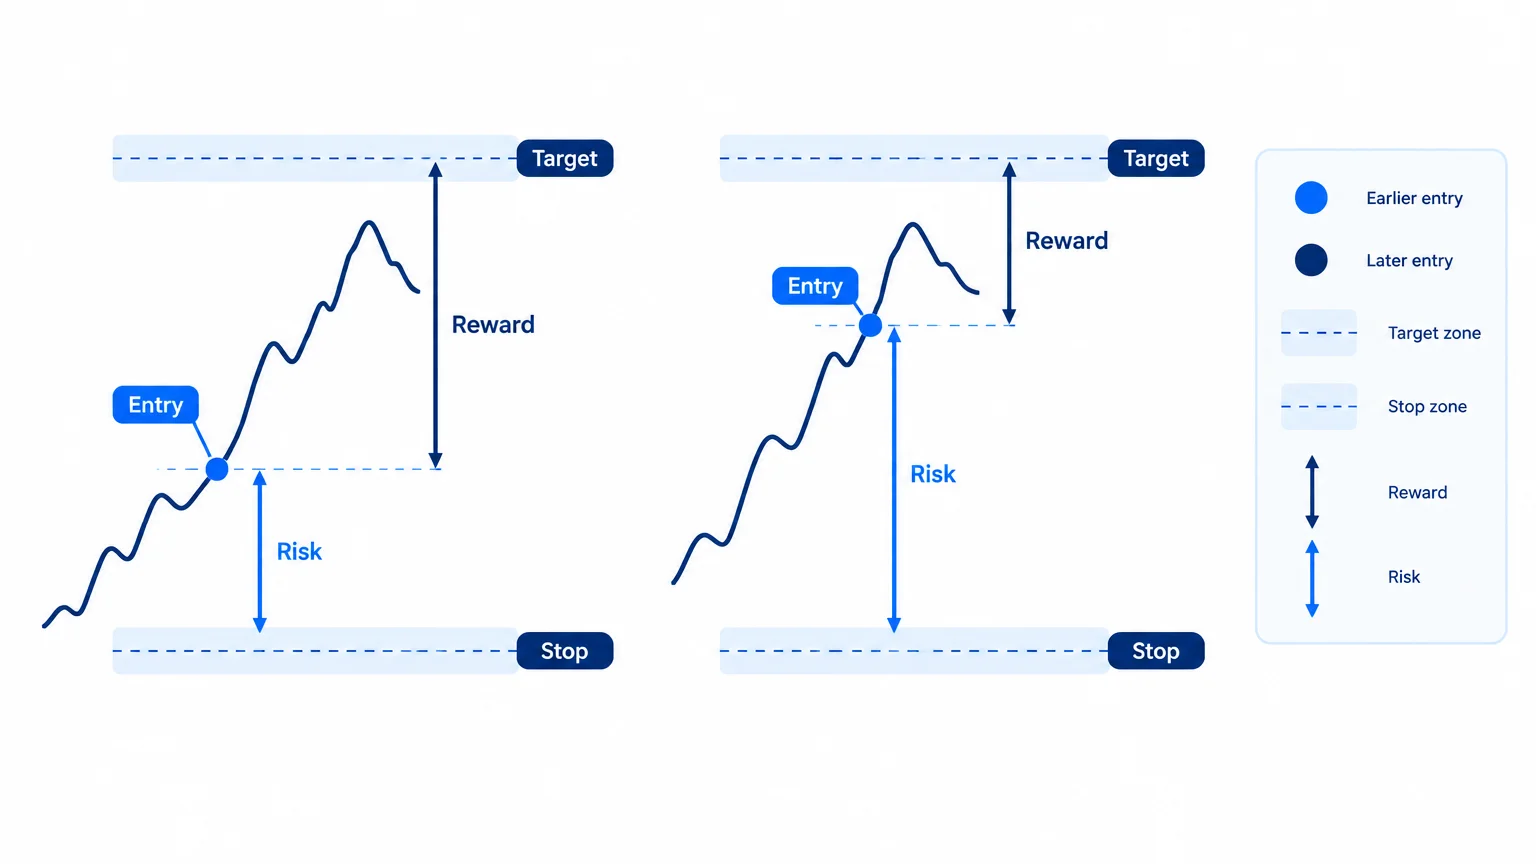
For a long position, the basic price risk is entry minus planned stop, while potential reward is target minus entry. For a short position, the directions reverse. These distances must be positive for the intended setup. A target on the wrong side of entry is not a favorable objective merely because a calculator accepts the number.
Calculate an illustrative example
Suppose a fictional long entry is 100, the planned stop is 96 and the objective is 108. The risk distance is 4 and the reward distance is 8. The ratio is 1:2 before costs.
If the actual entry becomes 102 while the stop and objective remain unchanged, risk becomes 6 and reward becomes 6. The opportunity is now 1:1. Using the earlier entry in your notes would misrepresent the trade you can actually take.
These are teaching values, not market quotes. Their purpose is to show why entry discipline and recalculation matter. The guide to entry zones explains the trade-off between waiting for evidence and losing room to the objective.
Convert price distance into money
For ordinary shares, price distance multiplied by share count gives a basic cash estimate before costs. Other products require contract size, tick value, currency conversion or additional specifications. Do not assume that a one-unit price move has the same monetary meaning across stocks, currency pairs, gold products and futures.
The position-sizing guide covers this conversion. Margin is not a substitute for the calculation: the amount required to open a leveraged position is different from the amount that can be lost as price moves.
Use specifications from the actual broker or exchange. A familiar symbol can represent different products with different multipliers and trading conditions.
Include costs without double-counting them
Spread, commissions, financing and execution differences can reduce reward or increase loss. Decide whether your entry and exit prices already reflect the relevant bid or ask side. If they do, adding the same spread again would double-count it.
For a simple estimate, calculate the gross cash reward and risk, then adjust for costs not already included. A small target can become much less attractive after realistic friction. A large theoretical ratio is also unhelpful if the target cannot plausibly be executed at the assumed price.
Record the cost assumptions so you can compare planned and realized results later. An unexplained “net” number is harder to audit than a slightly less tidy calculation with visible components.
Understand the break-even relationship
In a simplified model with a constant reward multiple R, a full loss of one risk unit on every losing trade and no costs, the break-even win fraction is 1 divided by 1 plus R. At 2R, that is one third. This is algebra describing the assumptions, not evidence that a strategy can achieve that win fraction.
Real outcomes rarely fit the simplified model exactly. Partial exits, early closures, gaps and variable costs change average wins and losses. A more general review uses the observed average gain, average loss and frequency of each, with a sufficiently relevant sample.
Do not infer a strategy's quality from the ratio alone. A target that is reached very rarely can produce poor results despite a large nominal payoff. A high win fraction can also conceal occasional losses that dominate many small gains.
Separate planned R from realized R
Planned R uses the initial risk estimate as a reference. Realized R compares the actual outcome with that initial reference. If you change the stop after entry, keep the original denominator visible when evaluating the trade; otherwise, the reporting can become inconsistent.
Staged exits require a weighted calculation. If half the position closes at 1R and half at 3R, the gross result is 2R if both fill. It is not 3R for the entire original position. See TP1, TP2 and TP3 for examples involving remaining exposure.
Test whether the objective is defensible
Ask what lies between entry and target. A nearby resistance zone, range midpoint or major event can complicate the path. This does not make the objective impossible; it means the calculation needs context.
Avoid reverse-engineering levels to reach a preferred ratio. A closer stop must still make sense for the setup, and a farther target needs an analytical basis. If a valid stop and realistic objective leave insufficient room, the calculation has done its job by revealing a weak opportunity.
The stop-loss guide explains why a planned exit cannot be treated as an exact maximum loss. Stress-test the arithmetic with a worse fill rather than assuming the favorable and adverse paths are perfectly symmetrical.
Use the ratio in a decision checklist
Before acting, record the actual intended entry, the reason for invalidation, the nearest objective, the cash value per unit and the cost assumptions. Then calculate the ratio. If any input is uncertain, label the uncertainty rather than presenting a precise final number.
Afterward, compare the plan with execution. Was the entry chased? Did the target move? Did costs differ? These questions identify operational problems that a chart-based ratio cannot reveal by itself.
Compare scenarios using the same denominator
When comparing two entry plans, hold the definitions constant. One calculation should not include costs while the other omits them, or use a full target while the other assumes partial exits. Write the initial cash risk for each plan and state which result is being compared.
This is especially useful when a tool reports several candidate entries. A closer entry can have a more attractive ratio but a different trigger and chance of participation. A later entry can have more evidence but less room. The ratio describes one dimension of that choice. It cannot rank the alternatives fairly when their assumptions are hidden or inconsistent. A small comparison with explicit inputs is more informative than a single highlighted ratio.
Key takeaways
- State whether you mean risk-to-reward or reward-to-risk.
- Recalculate using the entry you can actually obtain.
- Convert distances using the real contract specifications.
- Treat break-even formulas as conditional arithmetic.
- Evaluate payoff alongside likelihood, costs and execution risk.
Frequently asked questions
Is 1:2 always a good ratio?
No. It says nothing by itself about the chance of reaching the target or the quality of the setup. Evaluate the method and realistic outcomes rather than treating one ratio as a universal approval threshold.
Can a trade lose more than one R?
Yes. If execution is worse than planned, the actual loss can exceed the initial risk estimate. Gaps, slippage and changes to the position can all affect the result.
Should I move the target to improve the ratio?
Only if the revised objective has a defensible basis in the method. Moving it solely to improve the arithmetic changes the displayed payoff without establishing that the opportunity is better.
How do partial profits affect R?
Weight each exit by the fraction of the original position closed there, then include the result on any remaining exposure. Deduct costs to obtain a net result and retain the original risk reference.
Does TradingInte's risk context replace my calculation?
No. Verify the inputs, instrument multiplier and execution assumptions yourself. A structured analysis can help organize the calculation, but the monetary consequences depend on the actual position and product.
Conclusion
Risk/reward is a useful constraint on a trading idea, not proof of an edge. Calculate it accurately, challenge the levels behind it and compare it with realistic execution. A ratio that persuades you to reject a poor entry is doing useful work.
Prepared with AI assistance
Keep exploring
 Risk Management
Stop Loss Explained: Define Risk Before Entering a Trade
Understand stop-loss planning, stop and stop-limit orders, execution uncertainty and the link between a defensible exit distance a...
Read article Risk Management
Take Profit Explained: TP1, TP2 and TP3 in a Trading Plan
Plan take-profit levels with clear reasons, calculate blended returns from partial exits and define what happens to exposure betwe...
Read article Risk Management
What Is an Invalidation Level in Trading?
Define a trading setup's failure condition, distinguish invalidation from stop execution and use price, time and event rules witho...
Read article