Technical Analysis for Beginners: A Practical Introduction
Learn the basics of candles, timeframes, market structure and indicators, then build a conditional chart plan with risk controls and a review process.
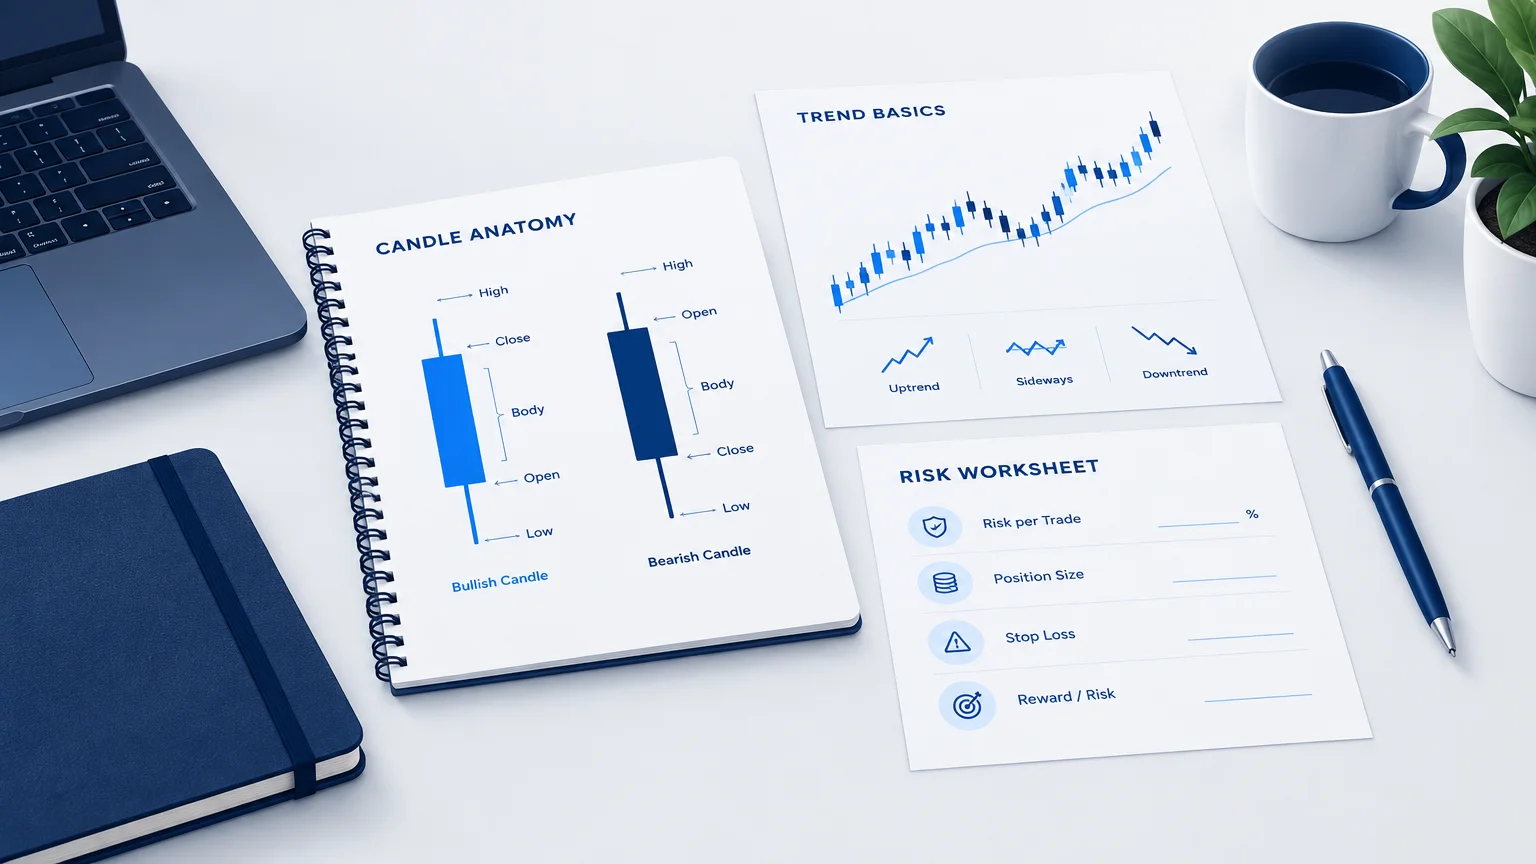
Technical analysis studies price behavior and, where appropriate, trading activity to organize market decisions. It can help identify trends, ranges, potential reaction areas and conditions that would invalidate a scenario. It cannot reveal the future with certainty or replace knowledge of the product being traded.
For a beginner, the most productive starting point is a small, consistent process. Learning many pattern names before understanding timeframes and risk often creates confidence without a usable decision framework.
Learn what one candle contains
A conventional candle summarizes an interval's opening, highest, lowest and closing prices. Its body and wicks show the relationship between those values. The same shape can have different significance depending on location and surrounding behavior.
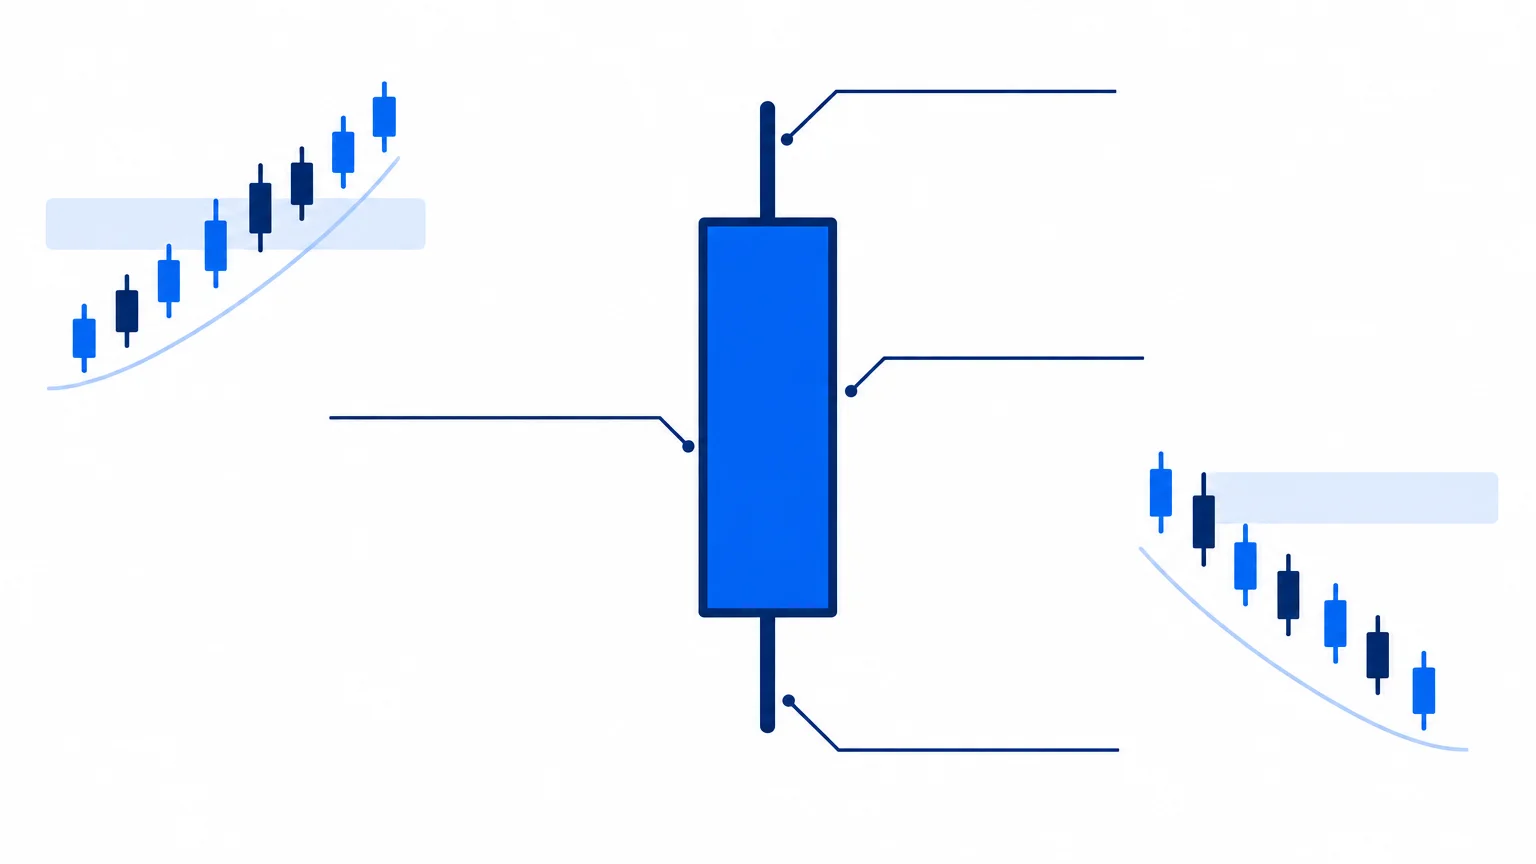
An unfinished candle is still changing. A dramatic intrabar move may close very differently from how it looked halfway through. Record whether your analysis depends on a completed close or on an event occurring during the bar.
Also confirm the chart type. Some representations transform or smooth prices. They may be useful for visual study, but their displayed values should not automatically be treated as executable market prices.
Understand timeframe before looking for signals
The timeframe determines what each bar summarizes. A shorter chart shows more detail and often more noise; a broader chart compresses that detail. Neither is inherently more profitable or more accurate for every question.
Choose a decision horizon that you can monitor and review consistently. Then use a broader view for context if needed. Switching among many charts until one supports the desired direction is a form of selection bias, not confirmation.
The practical trading chart analysis workflow shows how to move from context to a specific decision without losing that distinction.
Read trends and ranges first
Begin by describing important swings. Are they generally progressing upward, downward or sideways? Identify where current price sits within the larger structure. A candle near a range boundary asks a different question from the same candle in the middle of congestion.
Do not require every chart to have a clear trend. Uncertain transitions and overlapping ranges are normal analytical outcomes. The market-structure guide explains how to use these classifications without treating a minor break as a complete reversal.
Practice writing one sentence that describes the chart without forecasting it. This exercise often reveals whether you are observing price or projecting a preferred outcome onto it.
Mark support and resistance sparingly
Choose a few areas supported by visible reactions: prior swings, range boundaries or other meaningful features. Explain why each matters. Avoid filling the chart with lines that can justify almost any later movement.
Use zones where the evidence is imprecise. A cluster of reactions may be more honest than a single exact line. Then define how you will judge whether the area held, failed or remained ambiguous.
Read support and resistance for examples. The purpose of a level is to focus attention, not to promise that price will reverse there.
Add indicators only for a reason
An indicator transforms input data into another representation. A moving average smooths a price series; a momentum tool describes a particular aspect of change; a volatility measure summarizes movement under its formula. Understanding the question comes before choosing the tool.
Several indicators can repeat the same information because they are derived from the same prices. Agreement among them is not necessarily independent evidence. More panels can increase visual complexity without improving the decision.
Keep settings consistent while learning. If you change them, record why and evaluate the change separately. Otherwise, a review may compare several different methods while pretending they are one strategy.
Build a conditional scenario
A scenario connects a trigger to an interpretation and a failure condition. In an illustrative range, a sustained move above the upper boundary might support continuation, while a return inside could weaken that case. A wait condition covers the period when neither interpretation is sufficiently clear.
This is different from declaring that price “will rise.” Conditional language makes the idea testable and leaves room for uncertainty. It also clarifies what additional evidence is needed before considering exposure.
Do not force a trade into every scenario. Sometimes the nearest obstacle leaves too little room, the data is stale or an upcoming event makes execution difficult to estimate.
Learn risk arithmetic early
Entry, invalidation and target must describe the same setup. The distance from entry to a planned exit helps estimate risk per unit; position size translates that distance into money. Product multipliers and currency conversion can change the calculation.
The guide to risk/reward explains why an attractive ratio does not establish a winning probability. A target can be far away without being plausible. Likewise, a tight stop can make the ratio look better while contradicting the setup's normal movement.
Use hypothetical examples while learning, and distinguish simulation assumptions from actual execution. A chart-based exercise may omit spread, slippage, financing and emotional pressure.
Keep a learning journal
Save the chart, timestamp, timeframe, scenario and invalidation before revealing the outcome. Record whether the setup triggered and whether you followed the stated rules. Include examples you rejected, not only trades you took.
Review errors by type. A data-reading error differs from an inconsistent rule, and both differ from an ordinary losing outcome under a coherent process. This prevents every loss from producing an impulsive redesign of the method.
Avoid collecting only textbook winners. A useful learning set includes failed breaks, choppy conditions and examples with no clear opportunity. Those cases teach the limits of the method.
Use AI as a tutor, not an authority
Ask an AI tool to explain unfamiliar terms, identify visible swings or challenge your scenario. Then compare its response with the source chart. A model can misread labels, invent context or sound certain about an ambiguous pattern.
TradingInte can organize an analysis into bias, levels and risk context. Use those fields as questions to inspect. The final decision remains yours, and no technical method removes the possibility of loss.
Practice with a small worksheet
For each practice chart, answer six questions in writing: what is the instrument, which timeframe matters, what structure is visible, where is the relevant area, what would invalidate the scenario, and what information is missing? Keep the answers short enough to compare across examples.
Then review a different chart using the same questions. The exercise is valuable because it forces a stable sequence rather than encouraging a new technique for every pattern. When you cannot answer a question, record the gap instead of skipping it. After several examples, review the gaps themselves. They may show that you need to learn product specifications, recognize ranges more consistently or improve screenshot quality before adding another indicator.
Key takeaways
- Learn candles, timeframes and structure before collecting signals.
- Use a few meaningful levels and a small number of purposeful tools.
- Write scenarios with observable failure conditions.
- Study risk arithmetic alongside chart reading.
- Review records made before the outcome, including rejected setups.
Frequently asked questions
Do I need many indicators to begin?
No. Start with a readable price chart and a clear process. Add an indicator only when you understand what it measures and which decision it helps you make.
Does technical analysis work in every market?
Many descriptive concepts transfer, but market mechanics differ. Learn sessions, liquidity, contract size and order behavior for each product before applying the same visual method to it.
How long does it take to become consistent?
There is no reliable universal timetable. Progress depends on practice quality, feedback and the complexity of the method. Focus on making decisions reproducible before evaluating claims about performance.
Are chart patterns predictions?
They are descriptions used to form hypotheses. Their names do not establish a certain outcome. Context, definition, costs and evidence from relevant testing matter.
Should I trade while learning?
Educational chart review and simulation can help you understand the process without requiring immediate exposure. Any decision to use real money should account for your knowledge, circumstances and ability to absorb losses.
Conclusion
Technical analysis for beginners should start with disciplined observation. Describe the chart, mark the important areas, define a conditional scenario and calculate the consequences. Learning to recognize an unclear setup is as valuable as learning to name a clear one.
Prepared with AI assistance
Keep exploring
 Trading Education
Bullish vs Bearish Markets: Understanding Directional Views
Understand bullish and bearish views, separate forecasts from observed structure and define when evidence supports a directional o...
Read article