Bitcoin Chart Analysis: A Framework for BTC Price Structure
Use a dated BTC chart to identify structure, meaningful zones and conditional scenarios while checking the venue, product and exposure assumptions.
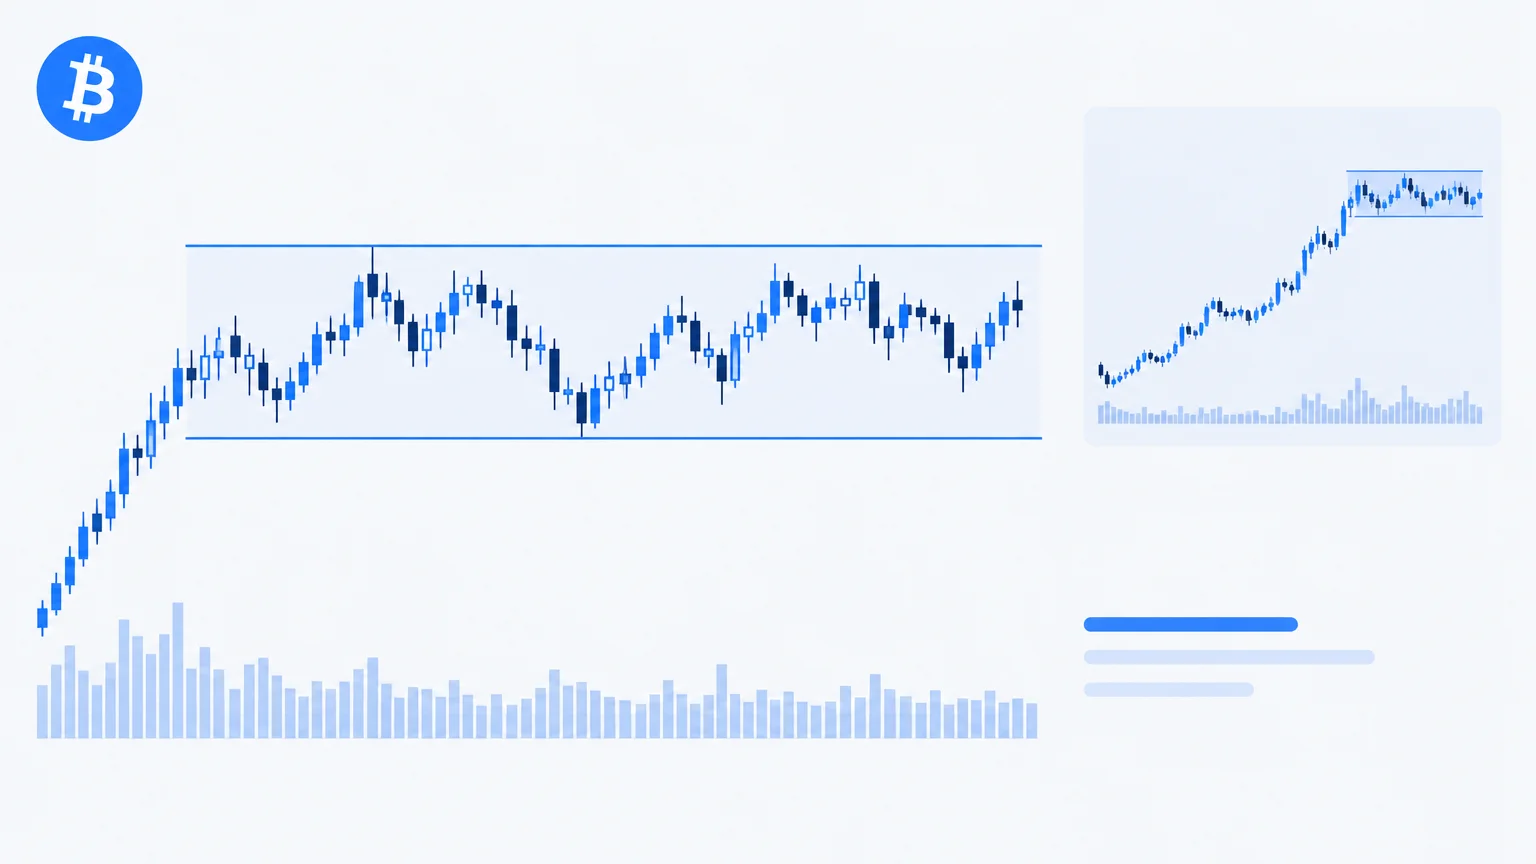
Bitcoin chart analysis is most useful when it begins with a precise question rather than a permanent bullish or bearish story. Which price series are you examining? What timeframe matters? What would make the current interpretation fail? These questions remain relevant regardless of Bitcoin's current price.
This guide is an evergreen framework. It contains no live BTC quote, current target or claim about the next market move. Apply the process to a dated chart and verify the product before using any level in a decision.
Identify the BTC instrument
Confirm whether the chart represents spot BTC, a perpetual contract, a dated future or another instrument. Note the venue and quote asset. A BTC/USD chart and a BTC pair quoted in another settlement asset may differ, particularly when market conditions become unusual.
For derivatives, identify the contract's multiplier, settlement and funding terms. For spot, understand the trading and custody arrangement. The asset name alone does not define these risks.
The broader crypto technical analysis guide explains why venue and product identification must precede a chart interpretation.
Begin with a structural description
On a broader chart, identify the important swings and any extended range. State whether price is progressing through higher levels, lower levels or overlapping trade. Then locate the current area within that structure.
Avoid allowing one dramatic candle to erase the surrounding history. A sharp recovery can remain below a meaningful prior high. A new local low can occur inside a much larger range. The market-structure framework helps distinguish those situations.
Use consistent swing definitions. If a historical turning point only becomes obvious after several later bars, do not pretend it was equally clear at the moment it formed.
Select a working timeframe
The working chart should match the intended holding period and monitoring ability. A broader context view can guide the interpretation, while a shorter view may answer a specific execution question. More charts are not automatically more evidence.
Write the relationship between timeframes in plain language. For example, a short recovery may be occurring within a broader decline. This is a useful description, not a contradiction that requires choosing one chart and ignoring the other.
When reviewing an AI output, check whether it silently switches horizons between its bias, entry and target. Those fields should belong to a coherent scenario.
Mark zones that affect the decision
Identify the nearest relevant swing areas, range boundaries and obvious consolidations. Use zones where the chart does not justify exact precision. Label the reason for each area and remove lines that do not change the analysis.
The support-and-resistance guide explains how to evaluate a response rather than assume that a level must hold. A frequently discussed level is still a hypothesis about behavior, not a guarantee of liquidity or reversal.
If your source differs from the execution venue, verify the level on the actual product. A screenshot from another market may be useful context but should not silently determine an order price.
Examine participation without overclaiming
Volume, open interest and funding can add context when their sources and definitions are understood. None reveals every participant's intentions. Rising activity during a price move does not by itself prove who is accumulating or distributing.
Keep spot and derivative observations distinct. If a metric covers one exchange, say so. Avoid combining unrelated feeds into a confident market-wide conclusion without understanding their coverage.
If you lack those data, a price-only review can still describe structure. It should simply avoid making participation claims the chart cannot support.
Build three conditional branches
Imagine a fictional BTC chart compressing beneath a range boundary. An upward branch might require acceptance beyond the boundary. A downward branch might involve a failed attempt followed by a break of the lower structure. A neutral branch covers continued compression and overlapping movement.
Specify what acceptance means under your method: a completed close, follow-through, a retest or another observable condition. Every definition has trade-offs, and none eliminates failed breaks.
The entry-point guide explains why waiting for more evidence can improve clarity while worsening the entry price. Evaluate the resulting opportunity rather than assuming confirmation is free.
Separate a BTC thesis from a trade
A broad belief about Bitcoin's future does not define a short-term entry or acceptable loss. If the purpose is a trade, state the invalidation and holding period. If the purpose is long-term exposure, do not use a tiny chart pattern as a substitute for a wider assessment.
Avoid changing from a trade to a long-term holding only after the setup fails. That changes the decision and its risk assumptions. A new thesis deserves a fresh assessment rather than being used to excuse an abandoned plan.
TradingInte can organize the technical scenario, but it does not determine whether exposure fits your circumstances or eliminate product-specific risks.
Check costs, exposure and monitoring
Calculate the cash consequences using the actual instrument. Include costs that are not already reflected in the quoted entry and exit assumptions. For derivatives, distinguish your planned exit from margin and liquidation mechanics.
Decide how the position would be handled while you are unavailable. Around-the-clock trading does not mean around-the-clock attention. Alerts can help monitoring, but they are not the same as an executable risk-control order.
Consider whether other holdings express a similar digital-asset risk. Different tickers can still respond to the same shock. Treat concentration as a portfolio question rather than a collection of unrelated charts.
Preserve an honest review record
Save the source chart, timestamp, scenario and assumptions before the outcome. Later, check whether the stated conditions actually occurred. Do not count a distant eventual move as success if the original scenario had already failed.
Record execution separately. A target shown on a chart may not represent a fill for the actual order. This distinction matters when evaluating whether the method is practical rather than merely visually persuasive.
Use a source comparison only for a defined reason
Comparing two BTC feeds can reveal whether a move is broad or source-specific, but the comparison needs matching timeframes and timestamps. Do not interpret an apparent difference before checking whether one chart is delayed or represents another product.
Write what the comparison is intended to answer. If the question is about an execution level, the actual venue remains central. If the question is broader market context, another source may be informative without determining the order price.
Avoid collecting many feeds simply to find agreement. A larger collection of charts can still repeat the same underlying assumption or introduce mismatched data. The useful outcome is a clarified source limitation, not a vote among whichever screens are easiest to access.
Key takeaways
- BTC analysis needs a venue, product and timestamp.
- Keep broader context separate from the working setup.
- Use a small number of defensible zones.
- Treat participation metrics within their source limits.
- Distinguish a long-term belief from an executable trade plan.
Frequently asked questions
Is this a current Bitcoin forecast?
No. It is a framework for examining current or historical charts. Any actual directional assessment needs a dated source and conditions that can be checked at the time.
Why do BTC charts differ between venues?
They can represent different trading activity, quote assets or products. Confirm those details before comparing levels. Similar symbols do not establish identical execution conditions.
Does a new high confirm continuation?
It changes the evidence, but its significance depends on timeframe and follow-through. A brief excursion can fail. Define confirmation before evaluating whether it occurred.
Can I rely only on a long-term Bitcoin thesis?
A long-term thesis does not answer short-term execution and exposure questions. Clarify the type of decision you are making and assess the risks appropriate to that horizon.
What should an AI BTC analysis include?
At minimum, a clear input description, visible evidence, conditional levels, invalidation and missing information. It should not invent a current price or infer market-wide data from a limited image.
Conclusion
Bitcoin chart analysis is a process of defining and testing conditions. Identify the product, map the structure and connect the scenario to realistic exposure. The result should remain useful even when it tells you that the evidence is insufficient to act.
Prepared with AI assistance
Keep exploring
 Crypto
 Technical Analysis: Reading Bitcoin and Crypto Charts
Analyze crypto charts while distinguishing venues, spot and derivatives, activity metrics, platform risks and the real execution b...
Read article