Crypto Technical Analysis: Reading Bitcoin and Crypto Charts
Analyze crypto charts while distinguishing venues, spot and derivatives, activity metrics, platform risks and the real execution behind a visual setup.
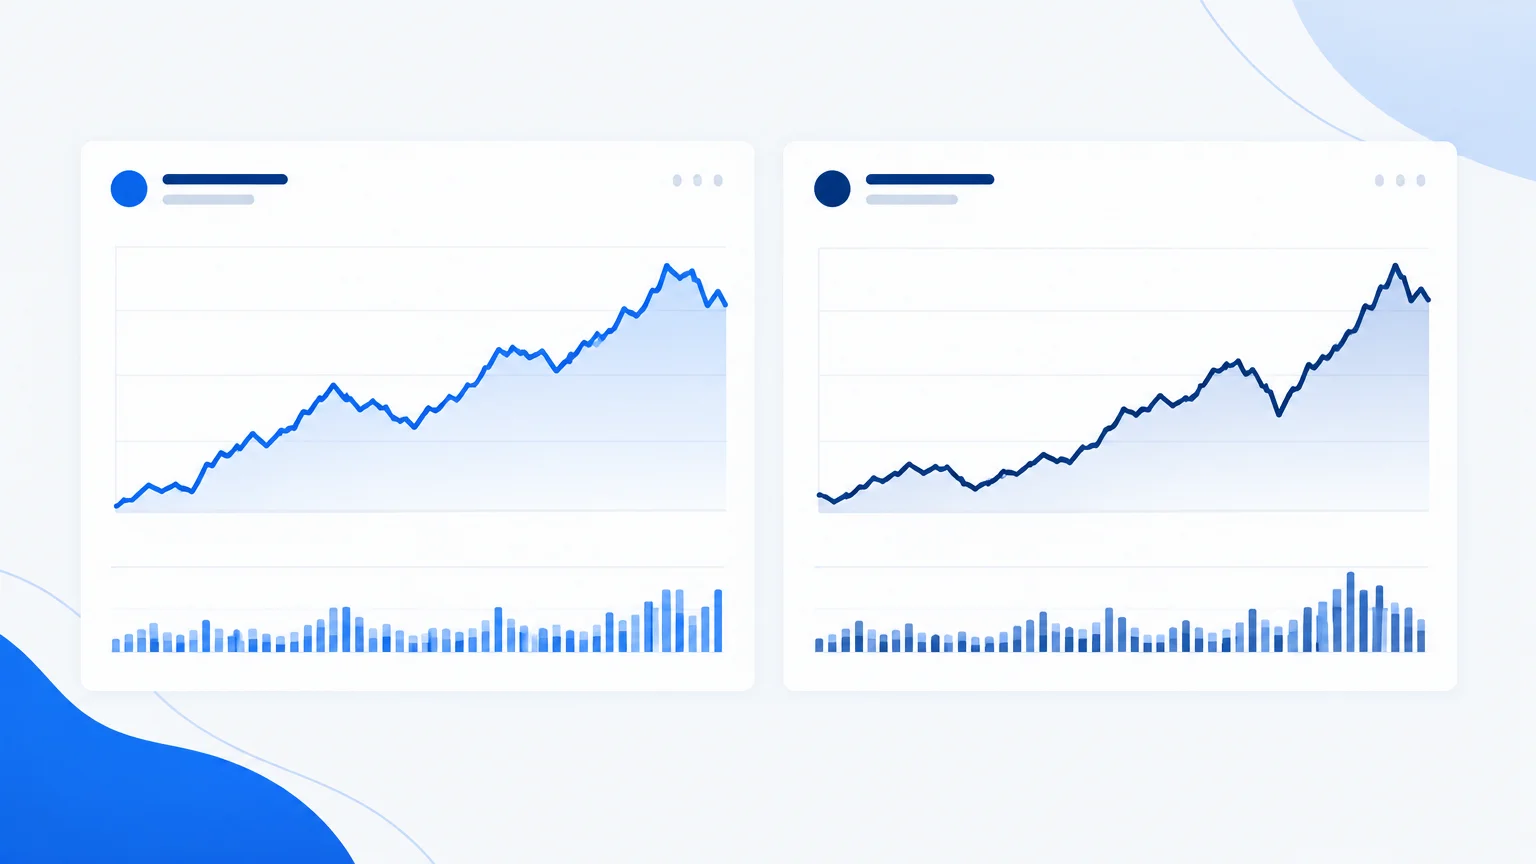
Crypto technical analysis examines price behavior in a market where the venue and product can matter as much as the asset name. A Bitcoin spot chart, a perpetual contract and a quoted pair using a different settlement asset may not describe the same execution environment.
The useful starting point is therefore precise identification, followed by a familiar sequence: structure, location, conditions and risk. A continuously available market still requires deliberate review times and exposure limits.
Specify the asset, venue and product
Record the exact pair, exchange and contract type. Distinguish spot ownership from derivative exposure. Check the quote or settlement asset, contract multiplier and whether the product has funding or expiry mechanics.
Do not assume that a price shown on one venue is available on another. Differences in liquidity, participants and product design can affect charts and execution. A screenshot without the venue label leaves an important question unanswered.
For a focused example, see the Bitcoin chart analysis framework. The same identification discipline applies to other digital assets, including those with much thinner markets.
Read structure before the latest dramatic move
Crypto charts can attract attention through large candles, but one bar does not establish the broader condition. Identify meaningful swings, ranges and the current position relative to them. State the timeframe and whether the candle is complete.
A short-term recovery can occur inside a larger decline. A new local high can remain below a much more significant resistance area. The market-structure guide helps keep those descriptions consistent.
Avoid treating intensity as clarity. Fast movement can make execution harder and increase uncertainty even when the direction appears obvious on the screen.
Map levels using the relevant feed
Choose support and resistance from the product you are actually analyzing. If another venue or a composite index is used for context, label it. Do not silently place orders from levels taken from a different price series.
Look for zones supported by visible swings and reactions. Thin trading or isolated price spikes can distort a level if interpreted without context. The support-and-resistance guide explains why a zone and an observed response are often more useful than a precise-looking line.
When the chart repeatedly crosses a level without a clear response, reconsider its usefulness rather than insisting it remains decisive.
Understand what volume represents
Volume on a particular exchange represents that source's activity under its reporting conventions. It is not automatically a complete picture of the entire asset's market. Differences between spot and derivative activity also matter.
If you use open interest or funding data, define the source and the metric. Those fields can add context, but they do not reveal every participant's intention or provide an automatic direction signal. Avoid interpreting one extreme reading as proof of an imminent reversal.
Ask what the data can establish and what remains uncertain. An AI explanation should not convert a source-specific observation into a claim about all market participants.
Separate chart risk from platform risk
A technically coherent setup does not address custody, venue outages, withdrawal restrictions or counterparty exposure. Those risks require separate assessment. The CFTC's virtual-currency trading advisory highlights the importance of understanding the product and leverage risks.
Do not treat the ability to trade around the clock as continuous access to equally good liquidity. Conditions can vary. A plan also needs an answer for periods when you cannot monitor the market.
This article concerns analysis, not an endorsement of a venue or a recommendation to use leverage.
Build a scenario rather than a permanent thesis
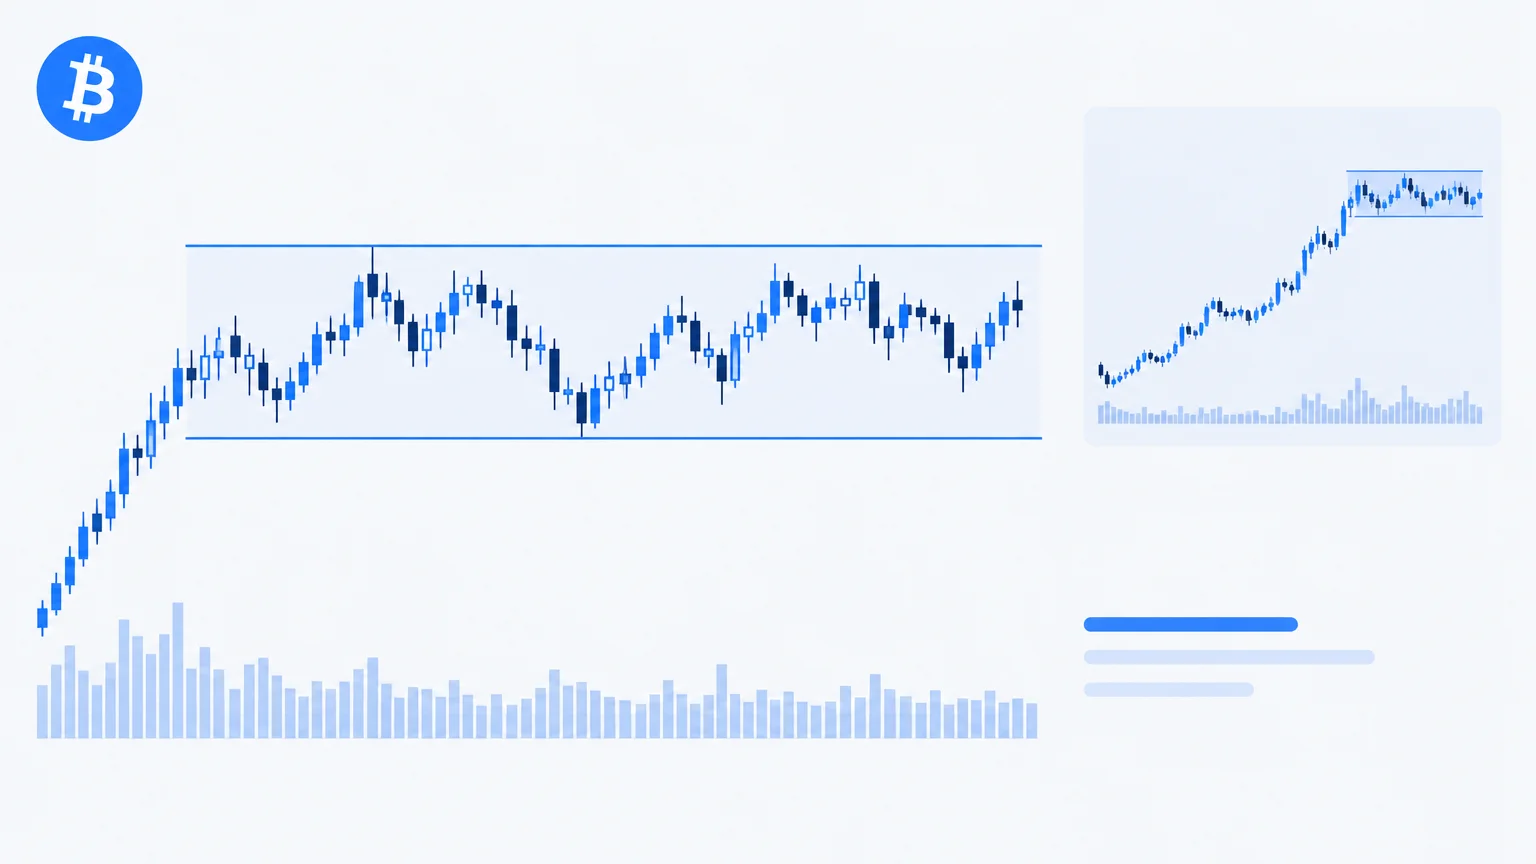
Suppose an illustrative asset breaks above a range and then returns toward its old upper boundary. An upward continuation scenario could depend on that area remaining accepted. A return into the range followed by failed recovery would weaken the case.
Write the timeframe, trigger and failure condition. Then inspect the nearest opposing area. If the actual entry is much later than the original break, the reward calculation may have changed materially.
The risk/reward guide shows why a favorable directional idea can still offer poor entry economics. A chart that already moved in the expected direction does not owe a late participant the same opportunity.
Use exposure controls that match the product
Calculate the cash effect of a move using the actual contract or unit specification. For derivatives, understand funding, margin and liquidation mechanics separately from the planned stop. A protective exit and a liquidation threshold are not interchangeable planning tools.
Consider concentration across assets. Several digital assets can respond to a common market shock, even if their charts appear different. Multiple positions do not automatically provide independent risk.
If a position cannot be sized within the intended limit because of contract increments or liquidity, rejecting it is a valid outcome. Do not make the stop artificially close merely to fit an oversized exposure into the calculation.
Review without selecting only winners
Crypto chart examples online often emphasize dramatic breakouts. Include failed moves, illiquid conditions and extended ranges in your own review. Save the analysis before the outcome so that later price action does not rewrite the original thesis.
Record execution differences as well as chart outcomes. A target touched on another venue is not necessarily a fill on yours. A theoretical entry visible between candles may not have been available at the assumed size.
TradingInte can help arrange the observations into a research note, but it cannot make an incomplete screenshot a complete market record. Verify the venue, timestamp and product details yourself.
Evaluate whether the chart is practically tradable
A visually orderly historical chart can hide limited executable depth. Before treating a pattern as a candidate, compare the intended size with the product’s actual liquidity and order constraints. A last-traded price does not establish that the entire position could enter or exit there.
Keep this separate from the question of whether the pattern is correctly identified. An analysis can be visually sound and operationally unsuitable. For smaller assets or unusual contracts, that distinction can dominate the decision.
If the necessary execution information is unavailable, mark the idea as incomplete rather than reducing the uncertainty to a confident target. The purpose of research is to expose constraints early. A decision-support tool should help make those missing pieces visible, especially when the supplied screenshot looks cleaner than the underlying trading conditions.
Key takeaways
- Identify the venue, pair and product before reading the pattern.
- Interpret activity metrics within their actual coverage.
- Keep platform and custody risks separate from chart risk.
- Evaluate concentration and leverage independently of confidence.
- Review realistic execution, not only visual target touches.
Frequently asked questions
Is crypto technical analysis the same as forex analysis?
Some chart concepts transfer, but the products and risks differ. Venue fragmentation, settlement assets, funding and platform exposure require their own checks rather than assumptions borrowed from currency trading.
Does a 24-hour market remove gap risk?
No. Prices can still move abruptly, liquidity can be limited and platforms can become unavailable. Continuous scheduled trading does not guarantee continuous execution at the price you expect.
Can funding predict the next move?
Funding can describe a particular aspect of a derivative market, but it is not a standalone forecast. Its meaning depends on the product, source and surrounding conditions.
Should I use another exchange's chart?
It can provide context if clearly labeled. For execution planning, verify the relevant levels and conditions on the actual venue and product rather than assuming prices and fills are interchangeable.
Can AI identify a safe crypto trade?
It can help organize evidence, but it cannot establish safety or eliminate market and platform risks. Reject claims that replace uncertainty with certainty simply because an AI system produced them.
Conclusion
Crypto technical analysis requires both a clear chart method and precise product knowledge. Identify the data source, define the scenario and assess the full exposure. A compelling pattern is only one part of the decision.
Prepared with AI assistance
Keep exploring
 Crypto
Bitcoin Chart Analysis: A Framework for BTC Price Structure
Use a dated BTC chart to identify structure, meaningful zones and conditional scenarios while checking the venue, product and expo...
Read article