AI Trading Analysis: How AI Can Help You Read Markets More Clearly
Learn how to evaluate AI trading analysis, verify chart evidence, define scenarios and check risk without treating a model's output as a prediction.
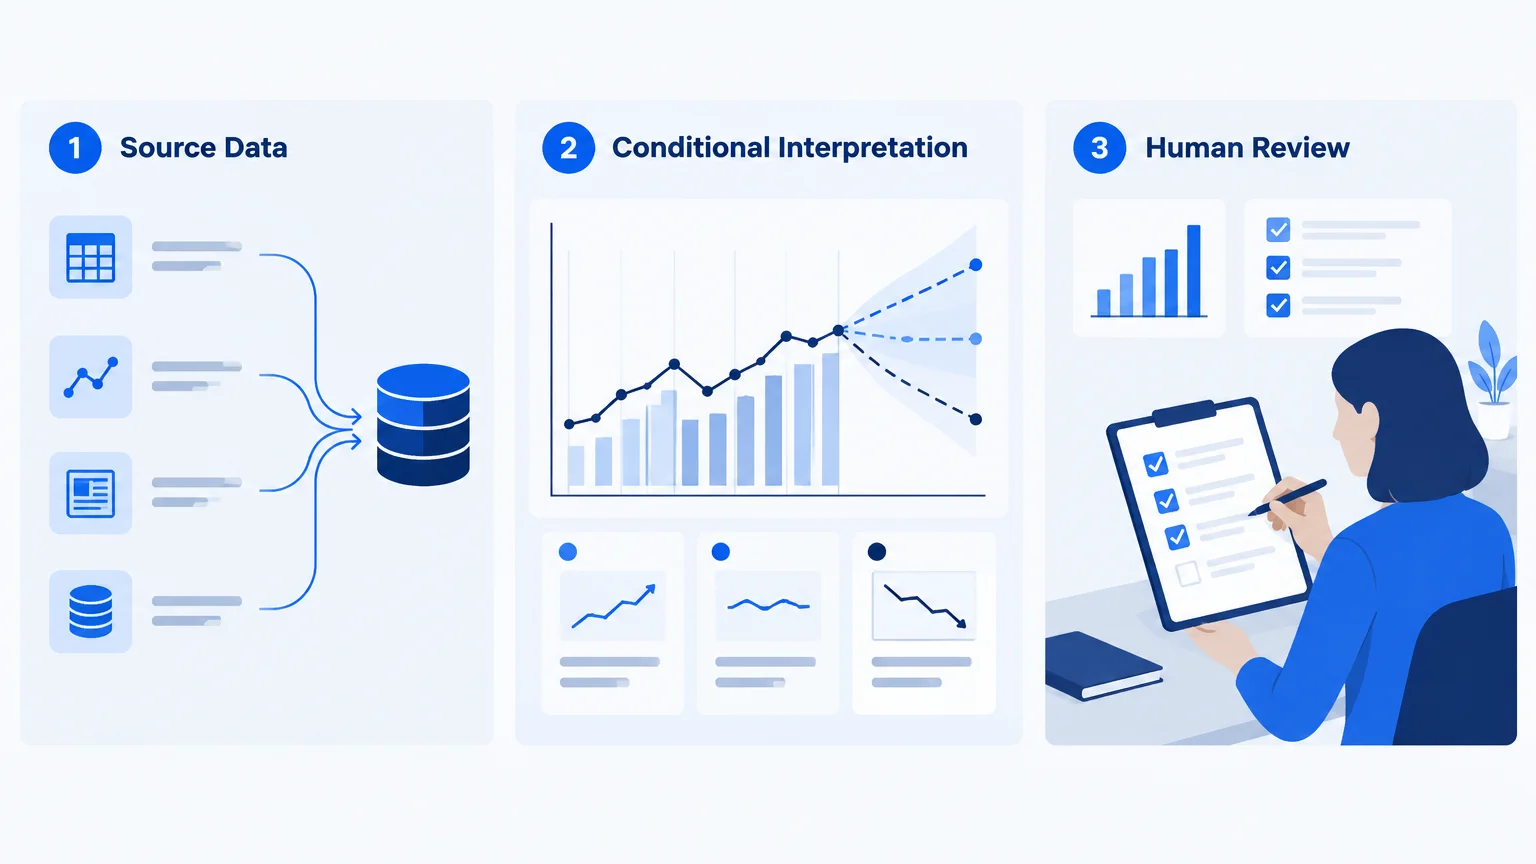
AI trading analysis is useful when it makes a market question easier to examine. It is less useful when a polished answer disguises missing data. A model may describe an upward trend correctly while overlooking a nearby earnings release, a wide spread, or the fact that the chart ended yesterday. Reading the response critically is part of the workflow, not an optional final step.
The practical goal is to turn observations into a conditional plan: what appears to be happening, what would support that interpretation, what would disprove it, and how much exposure the idea would require. This guide explains how to use AI for that purpose without treating its output as a prediction you must follow.
What AI trading analysis actually means
The term covers several different tasks. One tool summarizes news supplied to it. Another interprets a chart image. A quantitative model may process price history using explicit numerical rules. A language model can organize these inputs into a readable explanation. These capabilities are not interchangeable, and the label “AI” does not establish which data a product can access.
Begin by identifying the input. Is the analysis based on a screenshot, a current data feed, a historical file, or a written description? Then identify the timestamp, instrument and timeframe. A response based on an hourly chart should not quietly become a long-term investment recommendation. A screenshot-based response should not claim knowledge of events beyond the screenshot.
For a closer look at visual interpretation, see the workflow for AI chart analysis. The same discipline applies to text: every substantial claim needs either visible evidence, a verifiable source, or a clear label that it is an assumption.
Separate observation, interpretation and action
Consider a fictional chart with three progressively higher swing lows. “The visible swing lows are rising” is an observation. “Buyers appear to be defending higher prices” is an interpretation. “Enter a position now” is an action recommendation. Moving between these statements requires additional reasoning.
A useful output keeps those layers separate. It describes the swings, explains why they suggest an upward bias, and then states the conditions under which an entry might be considered. Nearby resistance may leave insufficient room for the risk. A scheduled announcement may make execution unusually uncertain. The correct outcome can be to wait.
Ask the model to explain the alternative case too. If it presents an upward scenario, request the evidence that would favor a range or decline instead. This is not about forcing equal weight onto every possibility. It is about identifying which observations would genuinely change the conclusion.
Build a repeatable analysis brief
Supply the instrument, venue or broker where relevant, timeframe, chart timestamp, and intended holding period. State whether prices are current, delayed, or historical. If you cannot verify freshness, say so rather than inviting the model to infer it.
Next define the question. “What is the market doing?” encourages a broad response. “Which visible swing level would invalidate an upward continuation scenario on this four-hour chart?” is narrower and easier to check. Request a small number of meaningful levels rather than a dense list of precise-looking numbers.
A practical brief can ask for:
- The visible structure and the evidence supporting it.
- The nearest relevant support and resistance zones.
- A trigger that must occur before considering an entry.
- An invalidation condition and its timeframe.
- Potential objectives, with obstacles between entry and each objective.
- Missing information that prevents a confident assessment.
These fields form a research checklist. They do not establish that a trade is suitable for a particular person.
Evaluate levels before evaluating confidence
A confidence label is difficult to use unless its meaning is defined. Does “high confidence” mean that the image is legible, that several indicators agree, or that a historically tested forecast has a calibrated probability? Those are different claims. A percentage supplied without a documented method should not be treated as a measured chance of profit.
Check the levels directly on the original chart. Can you see the swing or consolidation used to justify each zone? Are the units and decimal places correct? Does the proposed stop sit beyond the stated invalidation, or is it simply an arbitrary distance from entry? The guide to support and resistance explains why zones usually deserve more attention than isolated exact prices.
Also examine timing. An attractive area can already have been crossed by the time you read the answer. Revalidate the setup against your own current source instead of assuming the analysis updates automatically.
A hypothetical decision-support example
Suppose an illustrative stock chart shows a breakout followed by a pullback toward the old range boundary. An AI response identifies the boundary as a possible support zone and the next visible swing high as an objective. That is a starting hypothesis.
Before acting, check whether the pullback is still holding, whether the supposed breakout was only an intrabar spike, and whether there is another supply area before the target. Write a condition for abandoning the idea. If the planned entry is far above the zone, calculate the risk again using that actual entry rather than the more attractive price on the screenshot.
The risk/reward calculation can reveal that an otherwise coherent analysis offers little room after costs. A reasonable chart interpretation and an unattractive trade can both be true. AI should help expose that distinction, not hide it behind a confident narrative.
Keep news and event context traceable
News context is valuable only when its origin and timing are clear. Ask for the source, publication time and relevant event date. An old article about an upcoming meeting may refer to a meeting that has already happened. A company headline can concern a subsidiary, a preliminary proposal, or a different security with a similar name.
Verify consequential claims against an original release or official calendar. If no live source is available, use the analysis as a list of questions to research. Do not let a model fill missing context with plausible but unverified explanations for a price move.
Where TradingInte fits
TradingInte is a decision-support platform: find a setup, understand it, see the levels, then decide. Its analysis can organize market bias, technical context, entry zones, invalidation, possible targets and risk context. The user remains responsible for checking the inputs and deciding whether to act.
It is not an automatic trade-execution service. Product access and available inputs can differ by feature or account. The broader guide to AI trading tools and their limitations provides a checklist for judging any tool, including TradingInte, on evidence rather than presentation.
A useful final question
Before closing the review, ask which single missing fact could most change the conclusion. It might be an unreadable scale, an earnings date or the actual spread. Prioritizing that question is often more efficient than requesting another complete analysis of the same limited input.
Key takeaways
- Establish what data the AI received and when it was captured.
- Keep observations separate from scenarios and decisions.
- Verify levels on the original chart before considering exposure.
- Treat unexplained confidence scores cautiously.
- Record why you accepted, rejected or revised the analysis.
Frequently asked questions
Can AI predict the next market move?
It can produce scenarios or forecasts, but uncertainty remains. A convincing explanation is not evidence that a forecast is reliable. Evaluate the method, data quality and documented testing rather than assuming fluent language implies predictive accuracy.
Does AI trading analysis require live prices?
Educational review can use historical charts. Decisions about a current setup require current information from a source you can verify. Always match the data timestamp to the question and refresh stale levels before using them.
Should I follow a high-confidence AI signal?
A confidence label alone is insufficient. Check its definition, the evidence, invalidation, execution conditions and your risk constraints. If any of those are missing, the label cannot substitute for them.
How should I record an AI-assisted analysis?
Save the input, timestamp, initial response and your corrections. Record the scenario before the outcome is known. This helps distinguish useful reasoning from explanations that merely look persuasive after price has moved.
Is TradingInte an auto-trading bot?
No. TradingInte supports research and interpretation; it does not execute trades for users. AI output can be wrong, and market losses remain possible even when an analysis follows a sensible process.
Conclusion
The strongest use of AI trading analysis is a clearer, more testable decision process. Ask specific questions, check the evidence, and define what would invalidate the answer. An analysis that leads you to reject a weak setup can be more useful than one that supplies another reason to trade.
Prepared with AI assistance
Keep exploring
 AI Trading
AI Chart Analysis: How to Analyze a Trading Chart with AI
Prepare clear charts for AI review, check the model's observations and turn visible levels into conditional scenarios with explici...
Read article AI Trading
How to Analyze a Trading Chart Screenshot with AI
Prepare a clear chart screenshot for AI, protect account details, ask testable questions and verify the response before using its...
Read article AI Trading
 Tools: What They Can and Cannot Do for Traders
Evaluate AI trading tools by data quality, traceable evidence and realistic limits. Learn what to verify before relying on charts,...
Read article