How to Analyze a Trading Chart Screenshot with AI
Prepare a clear chart screenshot for AI, protect account details, ask testable questions and verify the response before using its levels in a decision.

A trading chart screenshot is a fixed view of a market, not a live data connection. AI can help interpret the visible structure, but the quality of the answer depends on what the image contains and what the request asks the system to do. Missing labels and hidden context cannot be repaired by confident wording.
This guide explains how to prepare a useful screenshot, ask a testable question and review the response. It is especially relevant when using TradingInte's Screenshot Analysis feature as a research aid rather than treating the output as an automatic trade instruction.
Decide what the screenshot should answer
Choose one main question. You might want help identifying the visible structure, comparing a breakout and failure scenario, or locating the area that would invalidate a proposed continuation. A narrow question is easier to verify than a request for a complete market forecast.
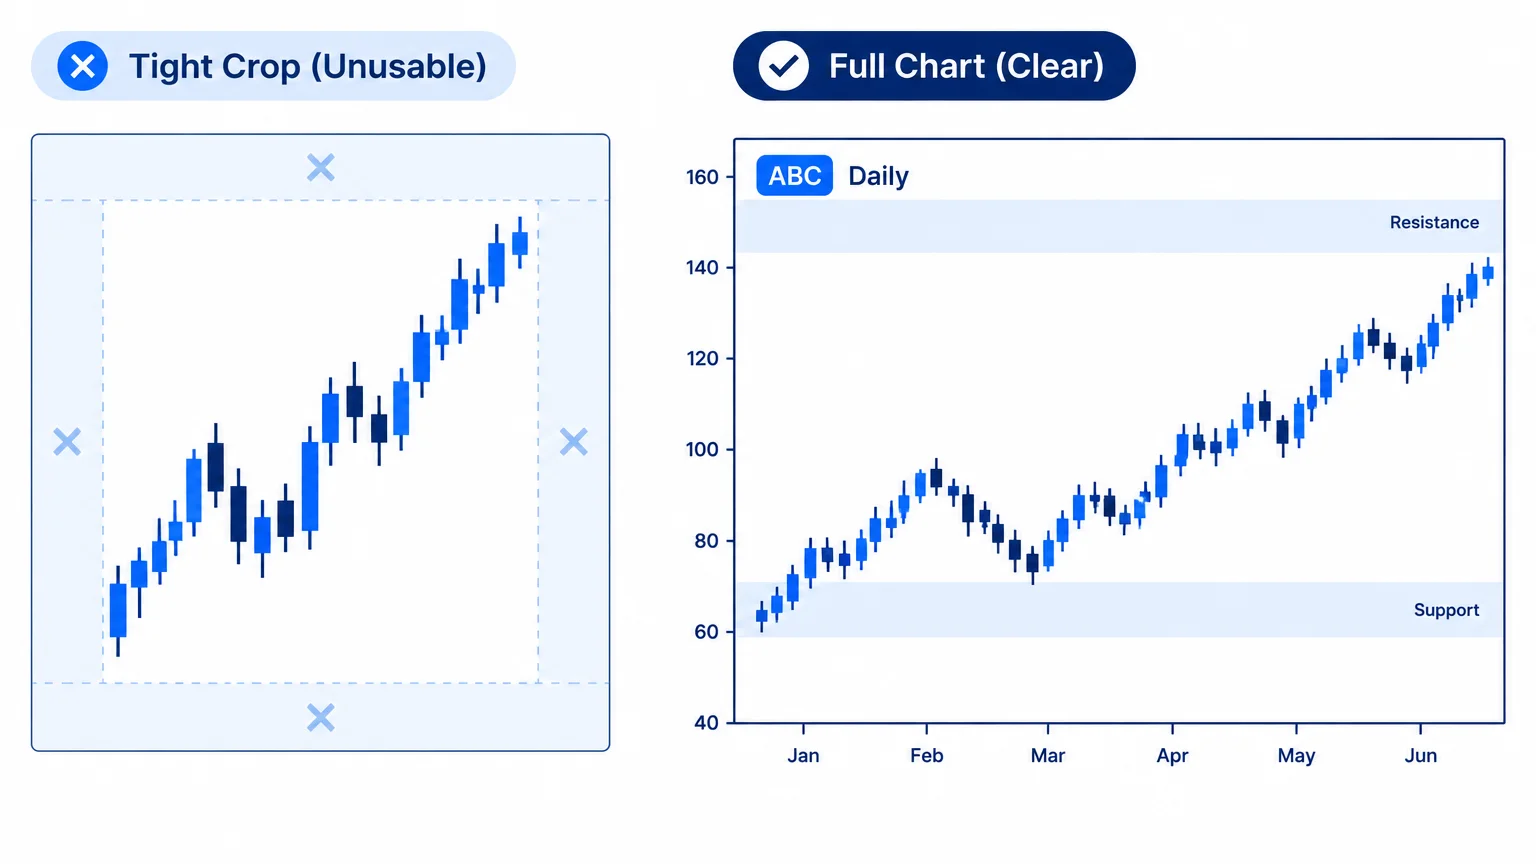
State the instrument, timeframe and intended holding period in text even if they appear in the image. Include the capture time and whether the last candle was still forming. If the data is delayed or historical, say so explicitly.
The broader AI chart analysis guide explains why observation, interpretation and action should remain separate parts of the response.
Keep the essential chart information visible
Include the symbol, venue or broker where relevant, timeframe, price scale and time scale. Show enough earlier price action to establish the surrounding swings and ranges. A close crop can make a local pattern look significant while concealing the major obstacle just outside the image.
Use a resolution at which labels remain readable after upload. Avoid stretching a small image or applying filters that blur candle boundaries. Check the saved file itself rather than assuming it matches the original platform view.
If several charts appear in one image, label the intended focus. Otherwise, the model may combine the scale from one pane with the structure from another.
Remove distractions and sensitive information
Hide account numbers, balances, names and other personal details before sharing. Keep only the panels needed for the analytical question. A cluttered interface can make it harder to distinguish market information from platform controls or account data.
Use a small number of purposeful indicators. If their settings matter, include them in the note. A line without a label could be a moving average, a manual drawing or an order marker; the model should not have to guess.
For platform-specific preparation, see the TradingView workflow and the MT5 chart guide.
Use a prompt that allows uncertainty
A practical request is: “Analyze only the visible chart. Describe the structure, identify the nearest meaningful zones and explain the evidence. Give a continuation, failure and wait scenario. State what information is missing. Do not invent unreadable prices, current news or data outside the screenshot.”
If you have an existing thesis, ask the tool to challenge it. For example, request the strongest visible evidence against an upward interpretation. This is more useful than asking the model to confirm that your planned trade is correct.
Do not require a fixed number of precise targets when the chart does not support them. The ability to say that a level is unclear is a useful feature of an analytical response.
Audit the first response before using it
Check the instrument and timeframe first. Then inspect whether the model correctly identifies candle direction, swing locations and the latest bar. Confirm every quoted numerical level against the scale.
Look for claims the image cannot establish: current spread, live news, exact order flow, hidden institutional positions or a measured probability of success. Unless separately supplied and verified, those claims should be treated as unsupported.
If a basic observation is wrong, correct it before discussing targets. Detailed reasoning built on a misread axis remains unreliable no matter how polished the explanation sounds.
Work through a screenshot example
Imagine an illustrative image of a range with the latest candle extending slightly above its upper boundary. The AI calls this a completed breakout. Your first correction is that the candle was still open when captured.
Ask for conditional branches instead. What would support acceptance above the range after the relevant close? What would a return inside imply? What observation would justify waiting? Then check whether each proposed zone is actually visible and legible.
The market-structure guide helps distinguish a temporary excursion from a meaningful transition. The screenshot alone cannot tell you what happened after capture, so refresh the source before making a current decision.
Convert the explanation into your own note
Write a short summary in your own words: the observed structure, the scenario you consider plausible, the trigger, the invalidation and the unresolved questions. This exposes whether you understand the answer or are merely repeating it.
Keep analysis levels separate from executable orders. A screenshot usually omits contract specifications, account currency and current trading costs. The tool cannot determine a complete cash-risk calculation without those inputs.
The position-sizing guide explains how to connect a defensible stop distance with actual exposure. A visually appealing setup still needs that separate calculation.
Know when a new image is required
Update the screenshot after a structural change, a relevant event or a material move away from the proposed entry area. Reusing an old image while asking for a current answer can create a false sense of continuity.
If the model repeatedly disagrees about basic visible details, simplify the image. Remove overlapping drawings, enlarge the relevant chart and provide missing labels. More elaborate prompting cannot always compensate for unreadable input.
When the uncertainty comes from the market rather than image quality, accept it. A clearer screenshot does not guarantee a clearer directional opportunity.
Review the process without hindsight
Save the original image, prompt, response and your corrections. Later, compare the outcome with the conditions written at the time. Do not replace the input with a later chart that makes the setup look obvious.
Track whether the AI helped you identify an error, reject a weak idea or ask a better question. Those benefits can matter even when no trade follows. Evaluating only profitable outcomes overlooks the value of a more disciplined review process.
TradingInte's role is to make the information easier to examine. It does not execute trades, guarantee a result or remove the need to verify the underlying chart.
Request a correction rather than a replacement story
When the model misreads one detail, identify the exact error and ask which conclusions depend on it. This produces a more useful correction than requesting an entirely new answer without explanation. You can see whether the changed observation affects the bias, levels or only the wording.
If several basic details are wrong, replace the image with a clearer one and restart the review. Preserve the failed attempt in your notes so you can recognize similar input problems next time. Repeatedly prompting around an unreadable scale is less effective than fixing the scale itself.
Key takeaways
- A screenshot is a dated, limited input.
- Preserve labels, scales and enough surrounding history.
- Remove sensitive details and unnecessary overlays.
- Ask for conditional reasoning and missing information.
- Verify levels and calculate exposure separately.
Frequently asked questions
Can AI recover information cropped out of the image?
It may guess, but that is not verification. Supply a better image or the missing information in text. Treat claims about hidden data as uncertain unless independently supported.
Should I upload a chart with my proposed levels?
You can, but identify them as your drawings. Otherwise, the model may treat them as platform data or adopt your assumptions without challenge. Asking for an independent description first can be useful.
Does a screenshot analysis remain valid all day?
Not necessarily. Its relevance depends on subsequent movement, events and the timeframe. Recheck the source whenever the conditions supporting the scenario may have changed.
Can the image reveal my true maximum loss?
No. It generally lacks contract, account and execution details. Even a complete planned-risk calculation cannot eliminate gap or execution uncertainty.
What is a good result from Screenshot Analysis?
A clear, verifiable description with useful conditions and acknowledged limits. A result that helps you reject an unsupported idea can be more valuable than one that produces an immediate trade suggestion.
Conclusion
Prepare the image as carefully as the question. A readable screenshot and a prompt that permits uncertainty give AI a better basis for analysis. Verify the response, refresh stale inputs and keep the final decision grounded in your own documented plan.
Prepared with AI assistance
Keep exploring
 AI Trading
 Analysis: How AI Can Help You Read Markets More Clearly
Learn how to evaluate AI trading analysis, verify chart evidence, define scenarios and check risk without treating a model's outpu...
Read article AI Trading
AI Chart Analysis: How to Analyze a Trading Chart with AI
Prepare clear charts for AI review, check the model's observations and turn visible levels into conditional scenarios with explici...
Read article AI Trading
 Tools: What They Can and Cannot Do for Traders
Evaluate AI trading tools by data quality, traceable evidence and realistic limits. Learn what to verify before relying on charts,...
Read article