MT5 Chart Analysis: Reading a MetaTrader 5 Trading Chart
Read MetaTrader 5 charts with attention to broker specifications, bid and ask prices, timeframes, indicators and practical exposure calculations.
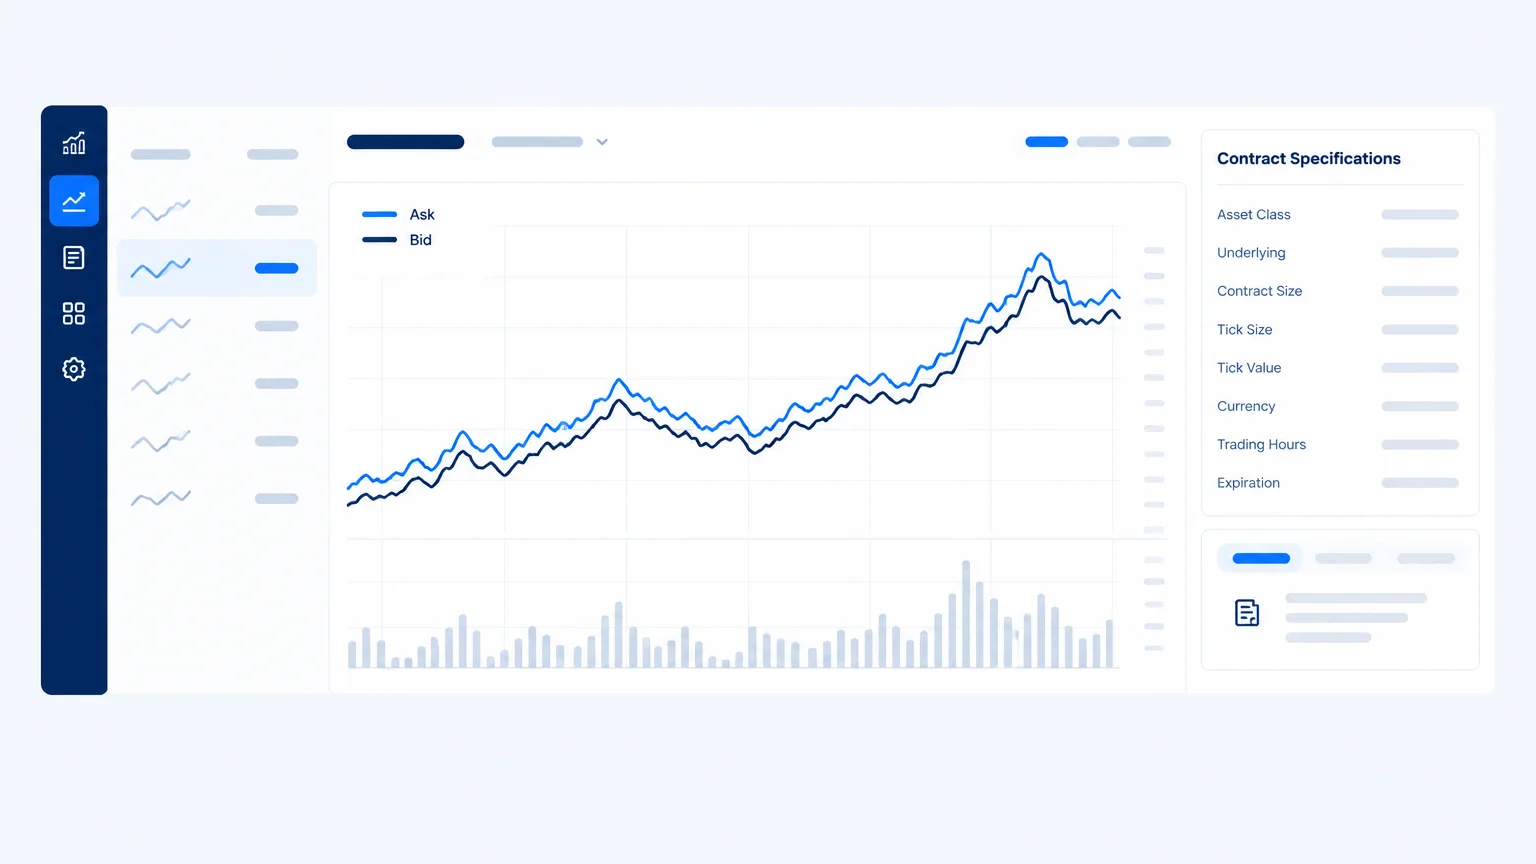
MT5 chart analysis begins with knowing which broker instrument the chart represents. MetaTrader 5 is a platform, while the broker supplies particular symbols, specifications and trading conditions. A familiar name on the screen does not guarantee that its contract size or price behavior matches another account.
The chart can help you read structure and prepare a scenario. Before translating that scenario into an order, verify the product and distinguish the displayed series from executable bid and ask prices.
Confirm the symbol specification
Check the exact symbol, contract size, minimum volume, volume increment and relevant trading hours. For a product quoted in a currency different from the account, determine how monetary results are converted. Do not rely on a generic lot-size example for a broker-specific instrument.
Similar symbols can represent different products, and brokers may use suffixes or naming conventions. Record the source in your research note so a later screenshot does not lose that context.
The position-sizing guide explains why the multiplier and minimum increment matter as much as the chart's stop distance.
Understand the displayed price
Bid, ask and, where applicable, last-trade prices serve different purposes. MetaTrader's chart documentation explains its chart construction and display options. Confirm the behavior for the actual instrument and feed rather than assuming the visible line is every executable price.
A spread can make an entry or exit differ from what a single-price screenshot appears to show. Check both sides of the quote when assessing execution. Also verify which conditions trigger the relevant order type at the broker.
Do not diagnose an unexpected fill from the image alone. Review the order details, timestamps and specification before concluding that the chart or broker behaved incorrectly.
Select the timeframe and history
Choose a timeframe that fits the intended decision. Keep enough history visible to identify the surrounding swings and ranges. A highly zoomed chart may make a small move look decisive while hiding the larger obstacle nearby.
Record the chart's time convention and the last completed bar. If comparing with another platform, check whether sessions, daily boundaries and data sources match. Differences in candles may reflect settings rather than a contradiction in the market.
The trading chart analysis workflow explains how to move from broader context to a working setup without letting each chart suggest a different method.
Read structure before adding tools
Describe the important highs and lows, any overlapping range and the current location. Then identify the few areas that could change the interpretation. If the chart is unclear, say so instead of adding indicators until a direction appears.
Indicators should answer specific questions about trend, momentum or volatility. Know the settings and inputs. Several tools derived from the same prices can agree without providing independent confirmation.
If you import templates or custom indicators, understand what they display before relying on them. A visually polished panel is not evidence that its calculations or signals suit the product and timeframe.
Mark levels and define conditions
Use zones around meaningful reactions when exact precision is not supported. Label each area with its reason, such as a prior swing or range boundary. The support-and-resistance guide explains why a line should focus observation rather than promise a reversal.
Write a trigger and invalidation in words. For example, a scenario may depend on acceptance beyond a range followed by a held retest. State the timeframe and what counts as acceptance. Avoid leaving those definitions to be decided after price moves.
An analysis drawing is not an order. Confirm separately whether any protective or target order exists and how the platform will manage it.
A hypothetical platform review
Imagine a currency chart showing a pullback into a former resistance zone. The visible structure supports investigating an upward continuation, but the current spread is materially wider than in the earlier chart segment.
The analytical zone has not necessarily changed, yet the executable opportunity has. Recalculate the actual entry, risk distance and remaining room using the current quote and contract specification. A clean pattern does not justify pretending costs are unchanged.
If a scheduled event is near, decide whether the setup's rules permit exposure through it. The forex analysis guide connects the chart to session and event context.
Prepare screenshots carefully
Retain the symbol, timeframe, readable axes and relevant history. Remove account numbers, balances and personal information before sharing. If an indicator matters, make its label visible or describe its settings in the accompanying note.
State whether the image comes from MT5 or MT4. The general analytical process can transfer, but interface features, account modes and product behavior should not be assumed identical. Verify the documentation and broker terms for the actual platform.
TradingInte can use chart images for structured review, but it cannot infer missing contract specifications or turn an old image into a current quote. Include the capture time and identify any incomplete candle.
Keep automation separate from analysis
The presence of an automated program or a signal panel does not make the chart's interpretation correct. If you use such tools, understand their permissions and behavior independently. This workflow does not require installing an expert adviser or changing any automated strategy.
Similarly, an AI explanation of a chart is not an instruction to enable automated execution. TradingInte provides decision support and does not execute trades for users.
Record and review the full decision
Save the chart, specification assumptions, spread observation and scenario. Afterward, compare both the price path and the actual execution. A chart target touched and an order filled are different events.
Classify discrepancies. Did the scenario fail, did the quote differ from the assumed price, or was the order configured differently from the plan? Specific questions lead to specific improvements and avoid blaming every unfavorable outcome on the same cause.
Verify the unit before entering a calculator value
Platforms and tools can use points, pips, ticks or raw price distances. These labels should not be treated as interchangeable. Write a small conversion example from the actual symbol specification, then check that the calculator expects the same unit.
For instance, the number of minimum price increments in a move is the raw distance divided by the instrument’s increment. Its monetary effect then depends on the value of each increment and the position size. Keep those steps explicit.
This is particularly useful when moving between currencies, metals and index products in the same terminal. The interface may look identical while the calculation changes. A familiar order window is not evidence that a memorized sizing shortcut remains valid.
Key takeaways
- The broker's symbol specification defines the actual exposure.
- Distinguish displayed prices from bid and ask execution.
- Keep timeframe, source and session settings in the record.
- Treat drawings and actual orders as separate objects.
- Share clean screenshots without personal account information.
Frequently asked questions
Is one lot the same for every MT5 symbol?
No. Contract size and permitted increments depend on the instrument specification. Verify them for the actual symbol before calculating monetary risk.
Why can a fill differ from the chart price?
Possible factors include bid and ask differences, order type, timing and market movement. Review the order record and broker rules rather than assuming a single screenshot contains all necessary information.
Can I use an MT4 screenshot with the same analysis method?
General chart-reading concepts can transfer. Identify the platform and product, and avoid assuming identical controls or account behavior. The image still needs readable labels and a timestamp.
Do I need a custom indicator for good analysis?
No. Start with the price structure and a defined question. Add tools only when you understand their calculations and can explain how they improve the decision.
Can AI calculate my MT5 position from a screenshot alone?
Usually the image omits essential account and contract inputs. Provide verified specifications and check the arithmetic independently. A chart level is not a complete exposure calculation.
Conclusion
MT5 chart analysis should connect visual structure with the broker's actual product rules. Confirm the symbol, read the chart and calculate the executable risk. Keeping those layers separate makes the final plan easier to verify and review.
Prepared with AI assistance
Keep exploring
 Technical Analysis
Trading Chart Analysis: A Practical Decision-Making Guide
Build a repeatable chart analysis process using market structure, meaningful levels, conditional scenarios and realistic risk and...
Read article Technical Analysis
Support and Resistance: Finding Important Price Levels
Identify meaningful support and resistance zones, assess how price responds and define failure conditions without treating chart l...
Read article Technical Analysis
Market Structure in Trading: Trends, Breakouts and Reversals
Read market structure through swings, trends, ranges and transitions. Define confirmation, invalidation and timeframe without rely...
Read article