TradingView Chart Analysis: A Practical Workflow for Traders
Build a readable TradingView workspace, verify symbols and settings, define alerts and scenarios, and prepare clear chart snapshots for later review.
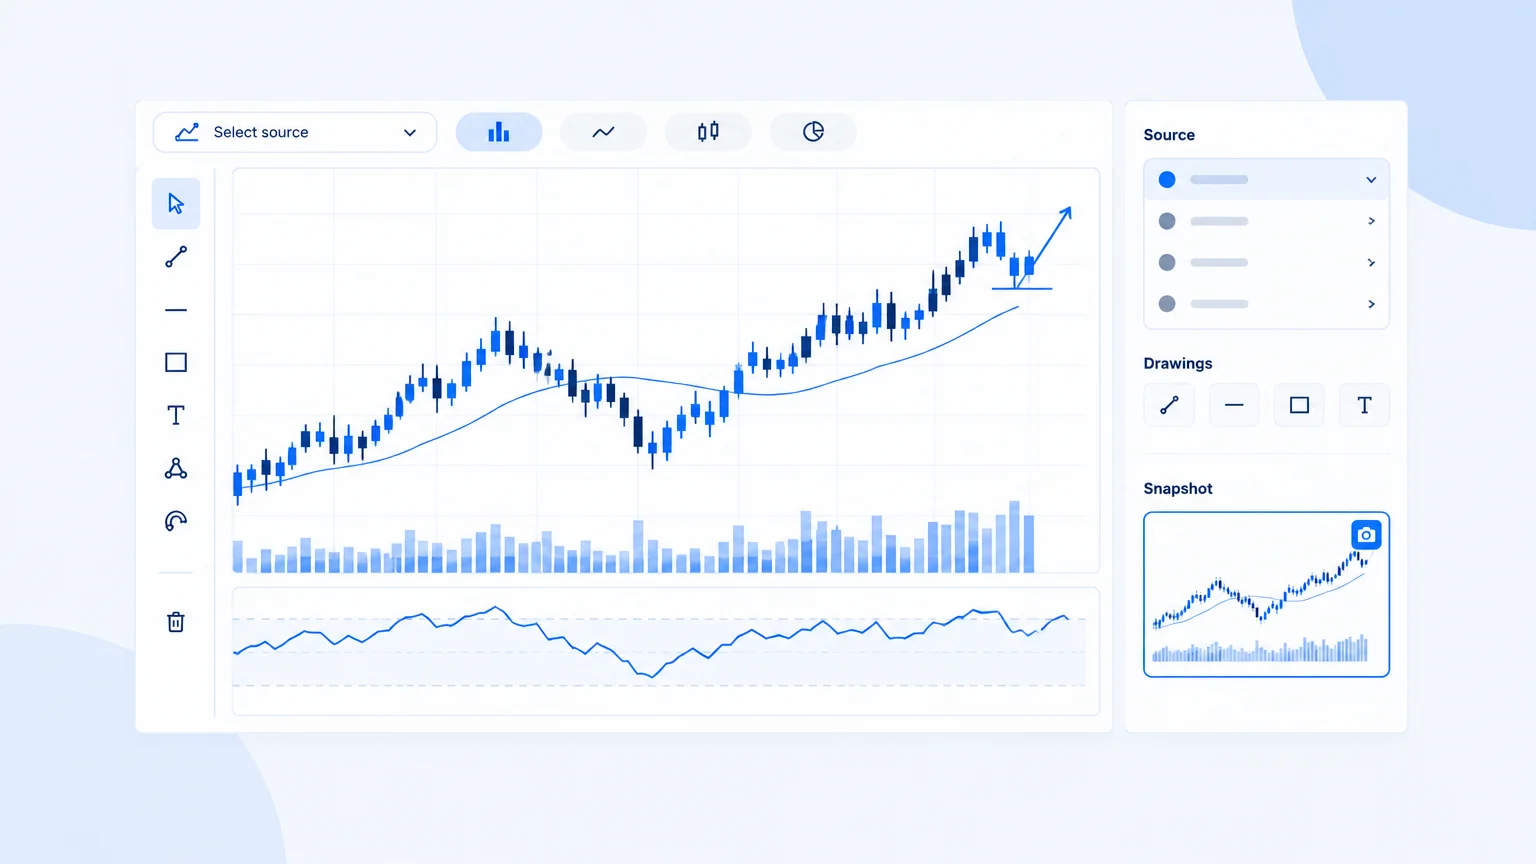
TradingView chart analysis works best when the platform supports a defined research process. A large library of indicators and drawing tools can help, but it can also make it easy to change the chart until it supports a preferred opinion. Start with the question, then configure the view around it.
This workflow focuses on a clean chart, consistent settings and a record that can be reviewed later. Interface details and feature availability can change, so use TradingView's official help for the current controls rather than relying on an old screenshot of a menu.
Choose the exact symbol and data source
Confirm the exchange, provider and instrument alongside the ticker. Search results can include several products with similar names. A stock, a derivative and a composite reference are not interchangeable for execution planning.
Record whether the displayed data is delayed and whether the current session is included. If you compare charts, keep the relevant settings consistent. A difference in sessions or adjustments can create apparent disagreement that has nothing to do with the underlying strategy.
TradingView's Supercharts introduction describes symbol selection and chart tools. The analytical responsibility remains to verify what the selected chart actually represents.
Build a restrained workspace
Begin with price, a readable scale and sufficient history. Add volume if it is relevant and its meaning is understood. Keep drawings sparse enough that the original candles remain visible.
Choose indicators according to questions. A trend reference, a momentum measure and a volatility measure serve different purposes, but even those may be unnecessary for a particular review. Avoid adding several tools that repeat the same input and then treating their agreement as independent confirmation.
The technical-analysis introduction explains this principle. The platform's flexibility is useful only when settings are part of a repeatable method.
Separate context from the working setup
Use a broader timeframe to identify the environment and a working timeframe to assess the decision. State the relationship between them. A short-term recovery inside a larger decline is a coherent description, even if the charts have different directional labels.
If using multiple panes, verify which symbol and timeframe each contains. Do not accidentally draw a conclusion from one pane while reading the price scale of another. When capturing an image, make the intended chart unambiguous.
The guide to trading chart analysis provides the sequence: identity, structure, location, conditions and risk.
Draw levels with written reasons
Mark a few meaningful swing zones and boundaries. Add a short note explaining why each matters. A level should help answer a decision question, not merely match several historical turns after the fact.
Keep analysis drawings distinct from actual orders. A rectangle marking an entry zone or a risk/reward drawing illustrates a plan; it does not establish that an order exists, will fill or has the same costs shown in the graphic.
If you move a drawing after price changes, preserve the original in a saved record. Otherwise, later review can accidentally evaluate a plan that never existed at the time.
Define the scenario before setting an alert
An alert can notify you that a condition occurred, but the condition needs a reason. Specify whether a simple crossing, a completed close or another event matters to the method. Check the alert configuration rather than assuming it follows every subsequent chart edit.
When notified, reassess the current chart and execution conditions. A notification is not the same as a trade instruction. Price may have moved, an event may have occurred, or the available reward may have changed since the alert was created.
The entry-zone guide explains why the actual entry must be recalculated after waiting for a condition.
Use historical review without hindsight
If a replay or historical review tool is available in your setup, use it to inspect the chart incrementally. Record your interpretation before revealing later bars. The exercise is less useful if you already know the outcome and unconsciously select the ideal turning point.
Include failed and ambiguous cases. A collection of attractive historical breakouts is not a balanced evaluation. Also distinguish the data shown by the review tool from the information and execution conditions that would have been available at the time.
Simulation does not reproduce every cost, fill constraint or emotional response. Treat it as one learning tool rather than proof of future results.
Prepare a screenshot for external review
Keep the symbol, timeframe, axes and relevant history visible. Remove account balances, personal details and unrelated panels. If indicators matter, retain their labels and settings or provide them in accompanying text.
TradingView provides a chart snapshot workflow. Regardless of how the image is saved, check the final file at normal viewing size before using it for analysis.
For an AI review, follow the screenshot analysis checklist. Ask the tool to acknowledge unreadable information rather than infer it.
Keep chart analysis separate from execution
The chart may use a data source different from your broker's executable quote. Confirm spread, order terms and contract specifications on the actual execution platform. A graphical risk box is not a complete cash-risk calculation for every product.
If the platform connects to a broker, verify the active account and order settings independently. This article concerns research workflow and does not require placing an order or enabling any connection.
TradingInte can help turn a chart image into a structured explanation, but it does not make the screenshot live or replace the original source. Keep the timestamp attached to the analysis.
A practical review note
At the end of the session, write the instrument, timeframe, chart timestamp, structural description, relevant zones, trigger, invalidation and unresolved questions. Add the saved image and any source needed to verify event context.
This compact record is more useful than a heavily annotated chart with no explanation of what you intended. It also makes later comparisons fairer because the original assumptions remain visible.
Keep a stable analytical template
Save a simple template for recurring research, including the indicators and settings you actually use. When you change it, note the date and purpose. Otherwise, a later review may compare charts generated by different methods without recognizing the change.
The template should standardize the process without forcing the same conclusion. A range and a trend should remain visibly different outcomes even when the layout is identical. Leave room for notes about missing data and event context.
If a published chart or shared link uses different settings, reconcile them before comparing levels. Consistent presentation helps communication, but only consistent definitions make the analytical comparison meaningful.
Key takeaways
- Confirm the exact symbol, source and session settings.
- Build the workspace around a research question.
- Distinguish drawings, alerts and actual orders.
- Save the original analysis before changing levels.
- Verify execution conditions outside the chart when necessary.
Frequently asked questions
Is TradingView itself a trading strategy?
No. It is a platform with analytical tools. The strategy consists of your definitions, conditions, risk controls and review process, not the presence of a particular chart layout.
How many indicators should I use?
Use only those that answer a defined question. More indicators can repeat information or obscure price. Start with a clean chart and add complexity only when it improves a specific decision.
Does an alert mean I should enter immediately?
No. It means the configured condition was detected. Recheck the scenario, current price and execution constraints before deciding whether any action is appropriate.
Can an AI analyze my TradingView screenshot?
It can interpret visible information if the image is clear. It cannot recover hidden settings, unseen history or current prices that were not supplied. Include the timeframe and timestamp explicitly.
Are historical chart tests enough to establish performance?
No. They can support learning, but selection bias, costs and execution assumptions must be examined. A convincing set of screenshots is not a substitute for a consistent and appropriately evaluated method.
Conclusion
Use TradingView to make your process clearer and more reproducible. Select the correct data, keep the chart readable and save a conditional plan. The quality of the workflow comes from the questions and controls, not the number of available tools.
Prepared with AI assistance
Keep exploring
 Technical Analysis
Trading Chart Analysis: A Practical Decision-Making Guide
Build a repeatable chart analysis process using market structure, meaningful levels, conditional scenarios and realistic risk and...
Read article Technical Analysis
Support and Resistance: Finding Important Price Levels
Identify meaningful support and resistance zones, assess how price responds and define failure conditions without treating chart l...
Read article Technical Analysis
Market Structure in Trading: Trends, Breakouts and Reversals
Read market structure through swings, trends, ranges and transitions. Define confirmation, invalidation and timeframe without rely...
Read article