AI Chart Analysis: How to Analyze a Trading Chart with AI
Prepare clear charts for AI review, check the model's observations and turn visible levels into conditional scenarios with explicit limits and invalidation.
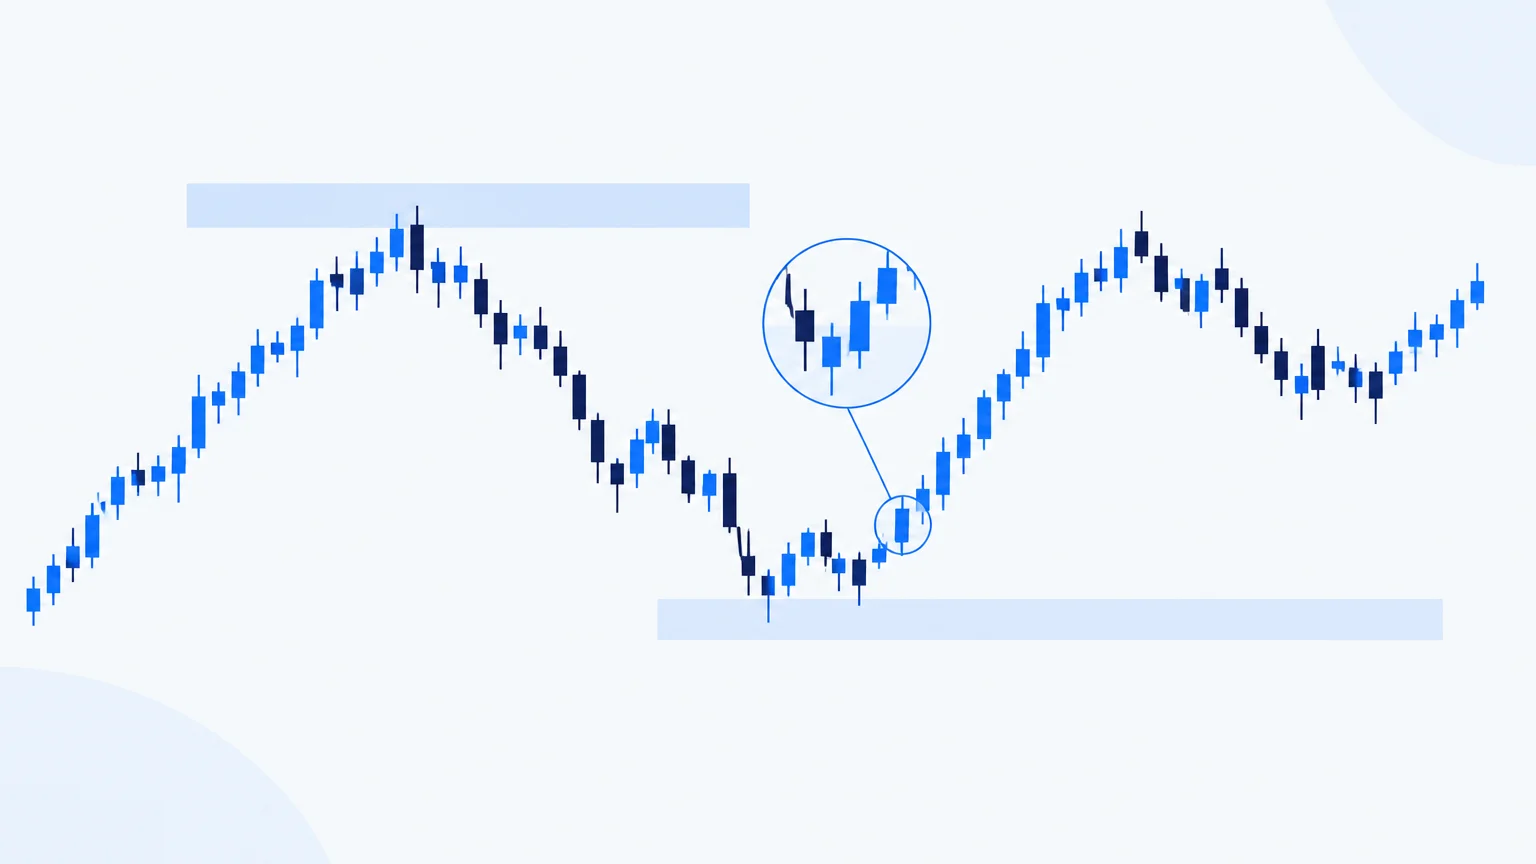
An AI chart analysis begins with pixels or price data, not with knowledge of what a trader intended. If the symbol is cropped out, the timeframe is unclear or a drawing covers the scale, the model may produce a coherent explanation of the wrong situation. Preparing the chart and defining the question therefore matter as much as the response itself.
The useful output is a small set of conditional observations that you can check on the source chart. This tutorial explains how to obtain that output, challenge it and turn it into a research note without mistaking visual interpretation for an instruction to trade.
Make the chart identifiable
Keep the instrument, venue, timeframe, price axis and time axis visible. Include enough history to show the structure surrounding the latest move. A tight crop of three candles may show a pattern but hide the larger resistance area immediately above it.
State the chart timestamp and whether the latest candle is still forming. A wick on an unfinished candle can become a strong close or disappear into a larger body. If the tool receives only an image, it cannot inspect later prices unless another data source is explicitly available.
The separate guide to trading chart screenshot analysis includes a preparation checklist. Use it before uploading charts with multiple panels, small labels or sensitive account information.
Request description before interpretation
Ask the AI first to describe what it can see: rising or falling swings, a sideways range, a recent gap, a contraction in candle size, or a move into a previously tested area. Require it to mark illegible details as unknown.
Then ask what those observations might imply. An upward sequence could support a continuation scenario, but a nearby range boundary might limit the opportunity. A sharp downward candle could reflect selling pressure, a news event or a data artifact. The image alone does not prove its cause.
This two-stage request makes errors easier to catch. If the model misidentifies the visible trend, there is little value in debating the targets it builds on that mistake.
Use a short, testable prompt
A practical prompt is: “Describe the visible structure on this chart. Identify two or three meaningful zones, explain the evidence for each, and give an upward, downward and wait scenario. State the event that would invalidate each directional scenario. Do not infer unreadable prices or information outside the image.”
Add your intended holding period. A daily chart can provide context for an intraday question, but it cannot reveal the exact intraday sequence. Ask the model to tell you what additional view would resolve the uncertainty rather than manufacture precision.
Avoid prompts that demand certainty, a fixed number of targets or a trade on every chart. Such instructions encourage the system to fill an output format even when the available evidence is weak.
Map structure before indicators
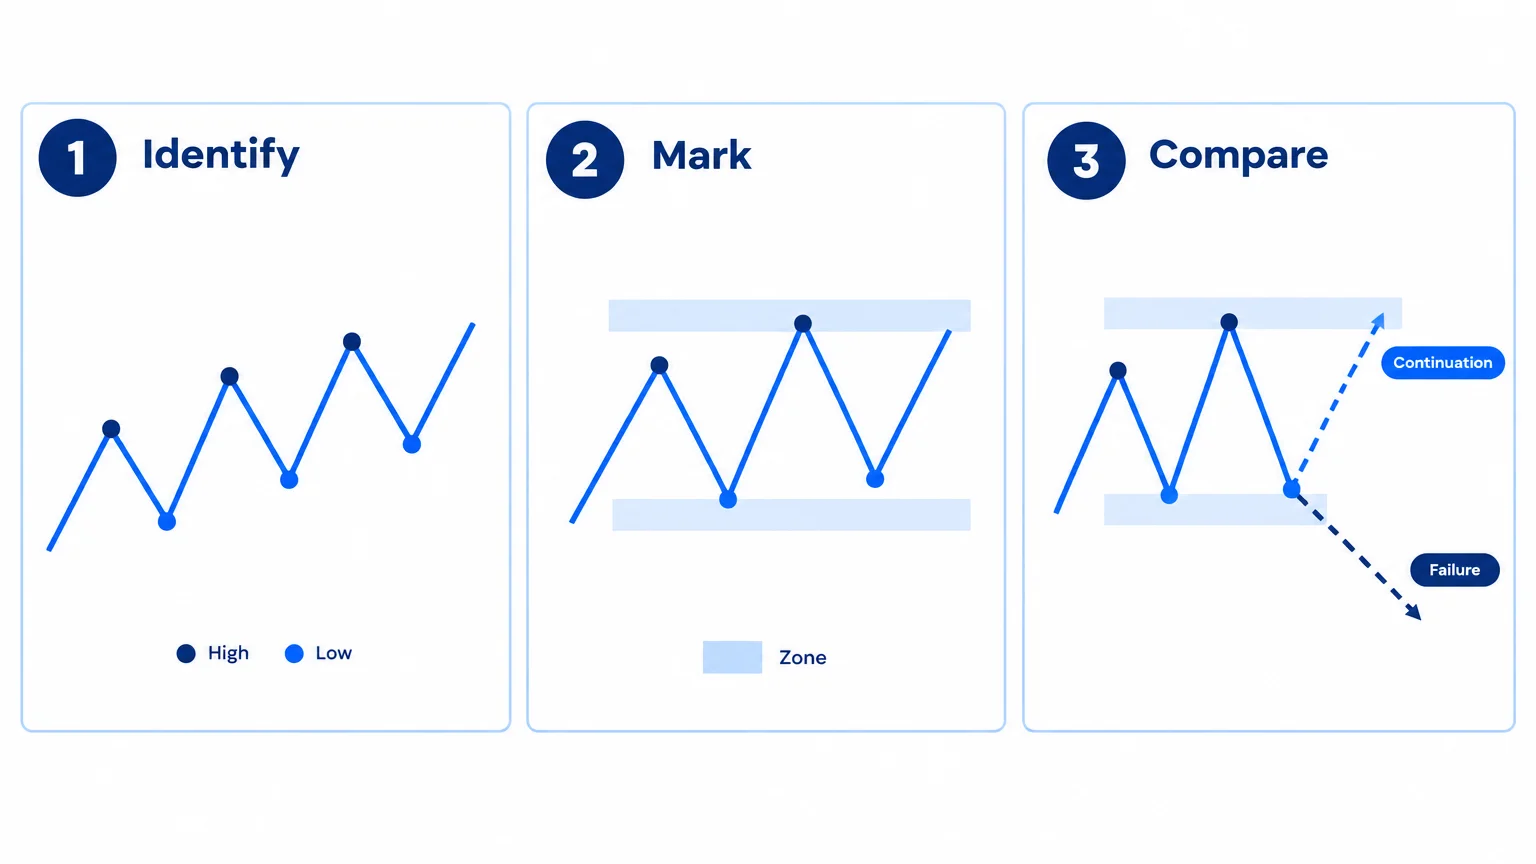
Start with swing highs and lows, range boundaries and the location of the current price within them. The market-structure guide explains the difference between a continuation, a break and a possible reversal.
Indicators can add context, but the model must know their settings and the data they use. A moving average is a transformation of price, so agreement between price and several moving averages is not several independent pieces of evidence. An oscillator at an extreme does not automatically reverse an established trend.
Ask which observation would change the analysis. If every possible price move can be explained as supporting the same prediction, the scenario is not sufficiently testable.
Turn lines into zones with a reason
An AI model may produce exact-looking levels because numbers make an answer feel actionable. Inspect whether the chart actually supports that precision. A cluster of candle bodies and wicks often suggests a zone, not a universally valid single price.
For each proposed level, record the reason: a prior swing, repeated rejection, a consolidation boundary or another visible feature. Do not accept a level merely because it is described as “institutional.” A screenshot generally cannot establish who placed orders or whether unseen orders remain there.
Review support and resistance to distinguish a useful reaction area from a promise that price must turn. Zones can fail, and repeated tests can change the context rather than simply strengthen the line.
Worked scenario: a breakout that has not earned its label
Imagine an illustrative chart where a candle trades above a range but has not closed. The AI calls it a confirmed breakout and places three targets above it. Before considering those targets, correct the premise: the candle is unfinished.
Write two conditions. If the relevant candle closes above the range and subsequent trading holds that area, continuation may remain a candidate. If it closes back inside and fails to reclaim the boundary, the breakout case weakens. A third condition is to do nothing while the evidence remains mixed.
Now inspect the potential entry relative to invalidation. Waiting for additional evidence can improve clarity but also worsen the entry price. Neither choice is universally superior; the trade-off must be stated. The guide to entry zones examines that balance in more detail.
Audit the output line by line
Check numerical levels against the axis, candle direction against the actual bars, and references to volume against whether volume is displayed at all. Confirm that the model has not mixed the main chart with an indicator panel or treated your manual drawing as observed market data.
Look for unjustified timing language. “Soon” is not a measurable condition. “After the next hourly close above the boundary” is more specific, although it still does not establish that the outcome will be favorable. Replace vague claims with observable events where possible.
If the answer changes substantially when you submit a cleaner image, treat that as evidence of input sensitivity. Keep the clearer image and document the correction rather than averaging contradictory outputs into a false consensus.
Use TradingInte as a structured review
TradingInte can help arrange chart observations into bias, levels, invalidation and possible objectives. The value is in making the reasoning inspectable. Verify that each field is supported by the supplied chart and distinguish missing data from neutral evidence.
After the review, save your own assessment alongside the output. Record the conditions under which you would revisit it. A chart analysis has a shelf life: a new swing, a major event or a materially different price can require a fresh review.
Preserve a clean reference image
Keep an unannotated version of the chart alongside your working copy. Manual arrows and target boxes can influence an interpretation by suggesting what the reviewer is expected to find. Comparing a clean view with the annotated one helps separate the original market evidence from the analyst’s additions. If a response depends heavily on a drawn arrow, ask whether the underlying candles support the same conclusion.
Key takeaways
- A legible, identifiable chart is the first requirement.
- Request visible evidence before directional interpretation.
- Use conditional scenarios rather than compulsory trade calls.
- Check numerical precision against the source image.
- Keep a record of corrections and unresolved questions.
Frequently asked questions
Can AI read any chart screenshot?
No. Cropping, low resolution, unusual chart types and hidden scales can limit interpretation. A useful tool should acknowledge those limits. Supplying a cleaner chart is better than relying on a detailed answer to an unreadable image.
Should I include all my indicators?
Include only those needed for the question and identify their settings. Too many overlays can obscure price structure. If an indicator is central to the analysis, make its scale and label readable.
Is an AI-drawn level an order recommendation?
No. It is a proposed area to investigate. You still need to assess current price, spread, invalidation, costs and exposure before deciding whether an order would fit your plan.
Can a chart image explain why the market moved?
It can show the move, but usually not establish its cause. Claims about news, institutions or hidden liquidity need additional evidence. Ask the model to distinguish visible behavior from a possible explanation.
What should I do when two analyses disagree?
Compare the underlying observations, timeframes and assumptions. Correct factual errors first. If both scenarios remain plausible, uncertainty may be the appropriate conclusion rather than a reason to request more confident wording.
Conclusion
AI chart analysis works best as an auditable conversation with the chart. Supply clear inputs, ask for evidence, and challenge the conditions behind every proposed level. The result should make the next research step clearer, including when the sensible next step is to wait.
Prepared with AI assistance
Keep exploring
 AI Trading
 Analysis: How AI Can Help You Read Markets More Clearly
Learn how to evaluate AI trading analysis, verify chart evidence, define scenarios and check risk without treating a model's outpu...
Read article AI Trading
How to Analyze a Trading Chart Screenshot with AI
Prepare a clear chart screenshot for AI, protect account details, ask testable questions and verify the response before using its...
Read article AI Trading
 Tools: What They Can and Cannot Do for Traders
Evaluate AI trading tools by data quality, traceable evidence and realistic limits. Learn what to verify before relying on charts,...
Read article